
Figure 1.
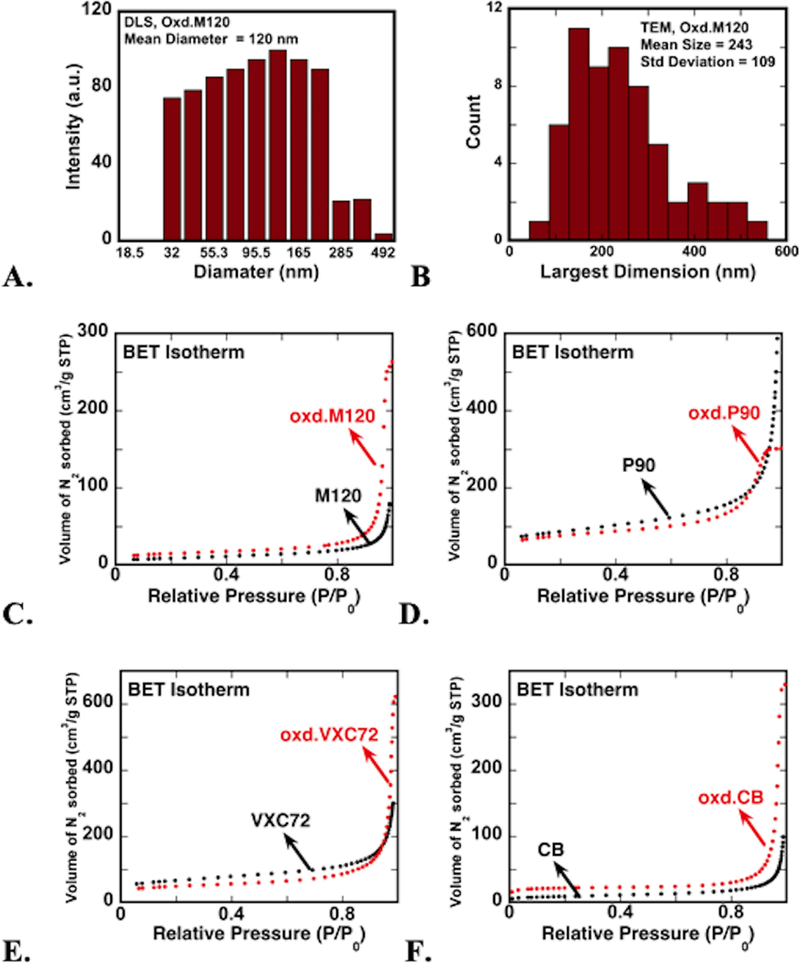
a. size distribution of oxidized m120 cnp dispersed in deionized water from dls measurement. b. distribution of largest dimension of oxidized m120 aggregates measured from tem images. c-f. nitrogen gas adsorption isotherms (at 77 k) of carbon nanoparticles before (black dots) and after (red dots) particle surface oxidation for four synthetic cnp (see table 1). see table s1 for numerical results of isotherm analysis.