
Figure 3.
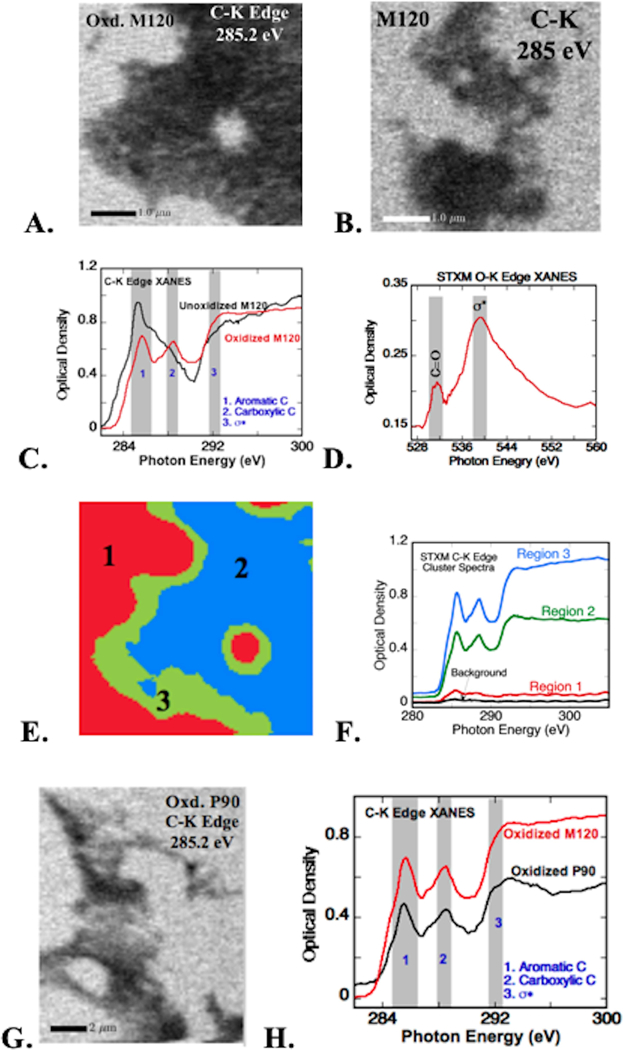
stxm images of a. oxidized m120 cnp and b. unoxidized (pristine) m120 at the carbon k absorption edge. c. carbon k-edge xanes before and after oxidation of m120 cnp (spectra collected from absorbing (dark) regions in a and b); shaded bands indicate the energy range of c absorption for aromatic and carboxylic acid groups, and ω* resonance. d. oxygen xanes collected at the dark region in a show features of c=o (531.5 ev) and ω* resonances (540 ev). e. cluster analysis of the stxm image in a showing spectroscopically distinguishable regions. f. carbon xanes spectra corresponding to the clustered regions in e (color in the image matches with spectra). g. stxm image of oxidized printex 90 (p90) cnp at c-k absorption edge. h. carbon xanes of oxidized p90 from absorbing regions in g; spectral ranges same as those marked in b.