
Figure 4.
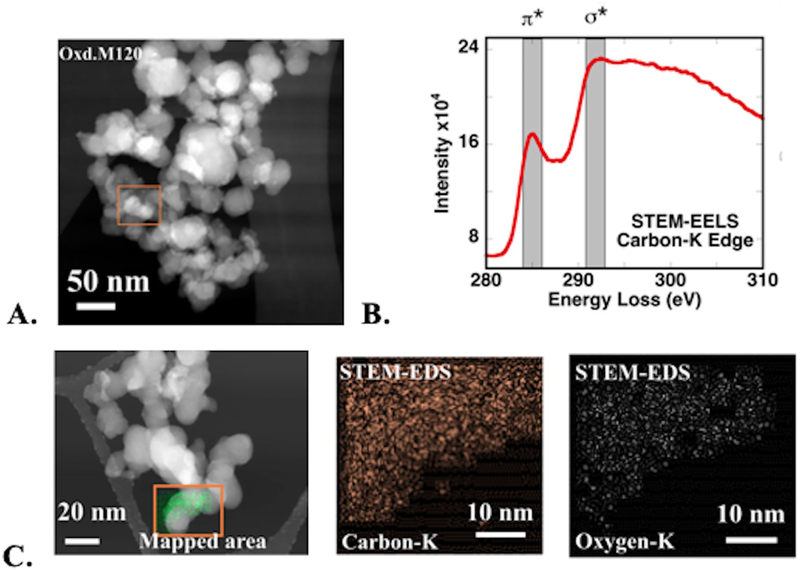
a. stem image of oxidized m120 cnp. b. carbon eels from the box marked in a; shaded bands show the energy range for π* and * resonances. c. stem-eds fluorescence maps showing the distribution of c and o atoms in the box marked in the stem image.