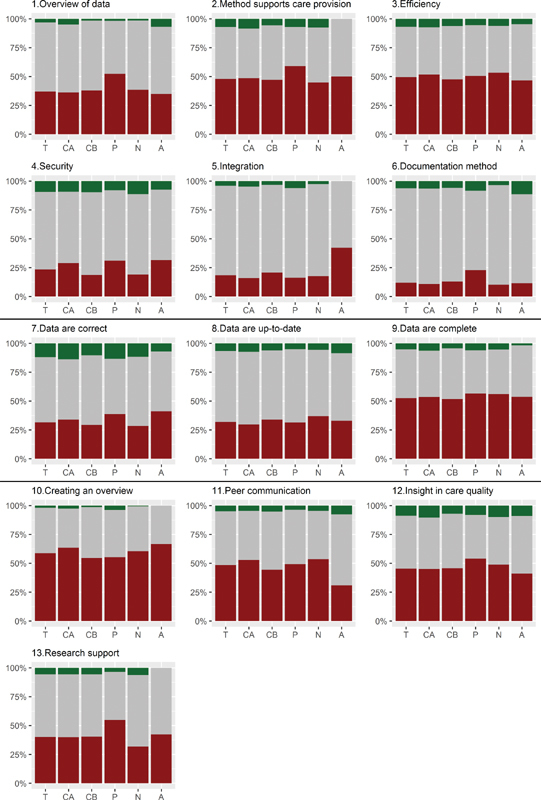
Fig. 1.

Per statement whether the effect of the implementation was worse than expected ( red , lower part of bar), as expected ( gray , middle part of bar), or better than expected ( green , top part of bar). For each statement six groups are depicted: total group double responders (T), center A (CA), center B (CB), physicians (P), nurses (N), and administrative staff (A).
