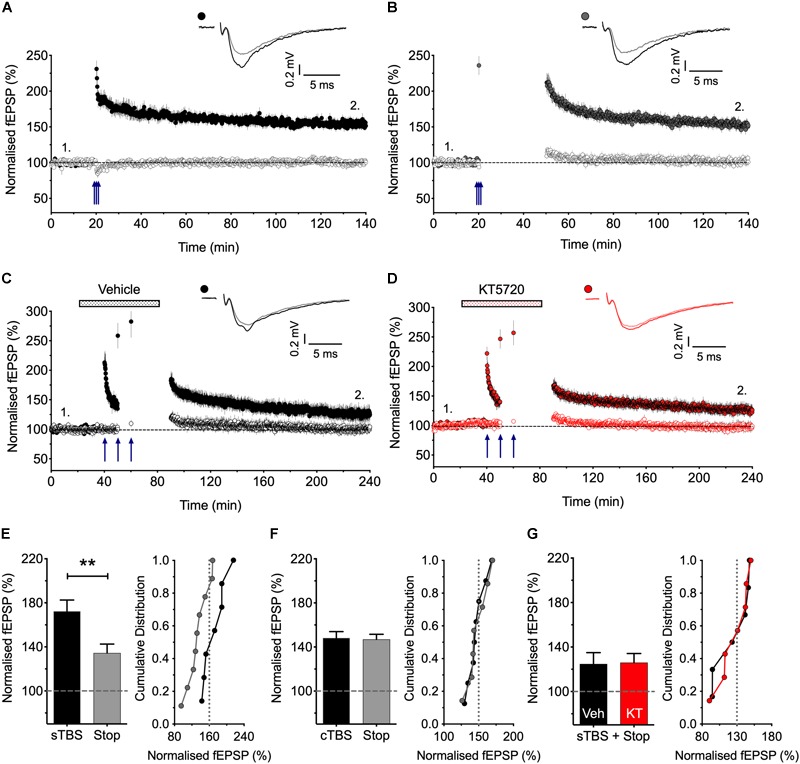
FIGURE 1.

Stimulation post-TBS is not required for LTP1. (A) Input specific LTP induced by cTBS from 8 experiments. (B) Similar LTP despite a 30 min pause in stimulation (after a test response following TBS to estimate STP; n = 7). (C,D) Equivalent sTBS experiments except that either vehicle (C) or KT5720 (1 μM) (D) was applied during the TBS from 6 and 7 animals, respectively. Note that KT has no effect on the residual LTP induced by sTBS when there is a pause in post-TBS stimulation. (E) Quantification of sTBS experiments (2 h post TBS). Data replotted from Park et al. (2016). (F) Quantification of cTBS experiments (2 h post TBS). (G) Quantification of the sTBS with stop stimulation experiments (3 h post TBS) performed either in the presence of KT5720 (KT) or vehicle (Veh). Sample traces are averages of 5 consecutive responses obtained from where indicated by numbers. ∗∗p < 0.01 vs. control.
