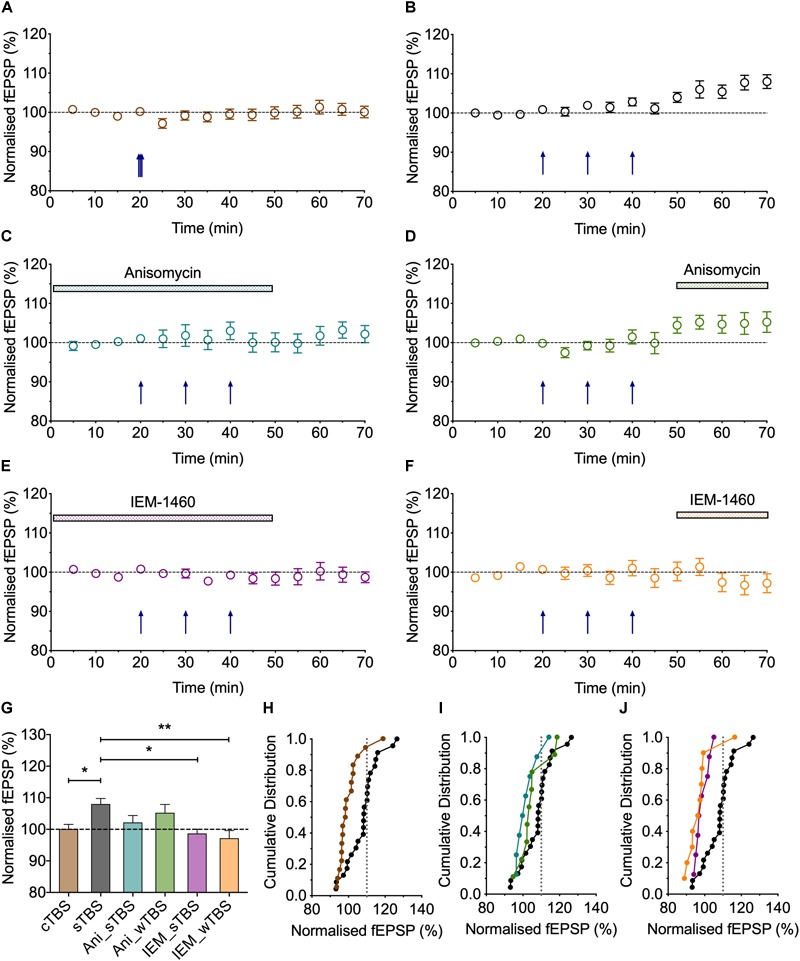
FIGURE 4.

Heterosynaptic LTP induced by a sTBS. (A,B) Pooled data of the non-conditioned inputs in response to delivery of (A) cTBS (n = 18) and (B) sTBS (n = 23). Data replotted from Figure 1, 3 and Park et al. (2016). (C–F) Pooled data of the non-conditioned inputs for sTBS in anisomycin (Ani, 30 μM; n = 8), (D) anisomycin delivered 10 min after sTBS (n = 9), (E) sTBS in IEM-1460 (IEM, 30 μM; n = 8) and (F) IEM delivered 10 min after sTBS (n = 10). Data replotted from Figure 5, 6. Each point is the average of responses recorded over a 5 min period. (G–J) Summary data with cumulative plots, quantified after 30 min of heterosynaptic LTP induction. ∗p < 0.05; ∗∗p < 0.01; comparisons vs. sTBS.
