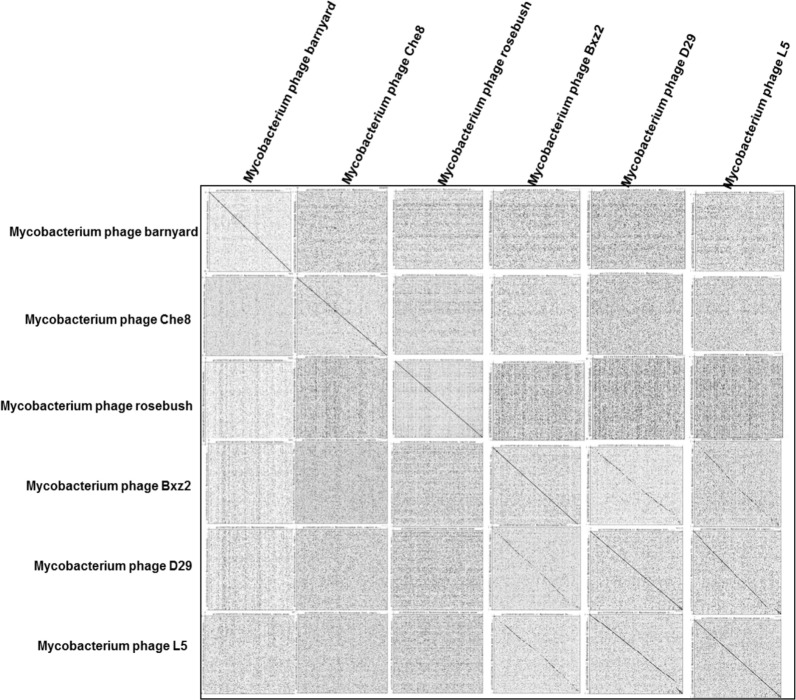
FIGURE 10.
Dot plot analysis of six Mycobacteriophage genomes, three with broad host range and three with restricted host range. Repeats within a single genome are depicted as dots, which extend into lines with as the repeats extend. Lines off the center line of the global comparison indicate sequence conservation between Mycobacteriophage genomes.

