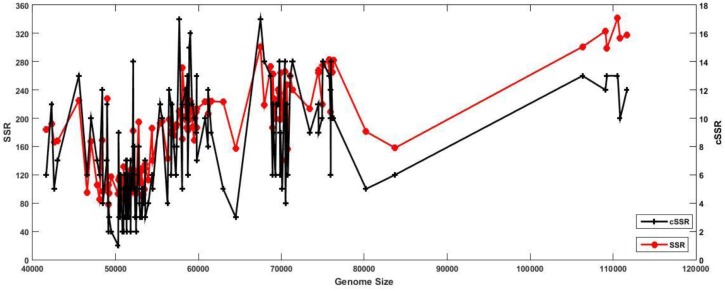
FIGURE 2.
Relation between genome size and SSR/cSSR incidence. The presence of some of the highest peaks (SSR/cSSR incidence) on the far left of the X-axis (smaller genome size) are a clear indication of comparable SSR incidences across varying length of genomes, thus implying their functional significance.

