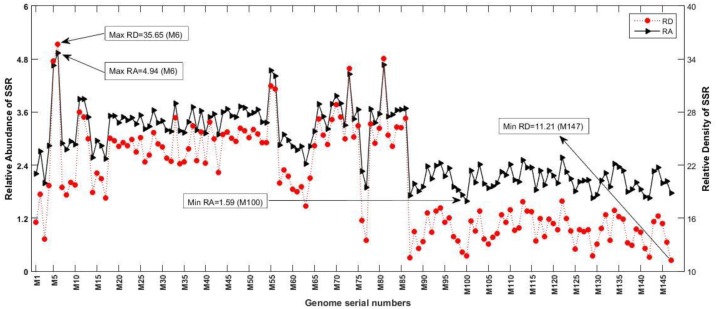
FIGURE 4.
Relative abundance (RA) and relative density (RD) of SSRs. RA is the number of microsatellites present per kb of the genome whereas RD is the sequence space composed of SSRs of microsatellites per kb of the genome. The variations in these variables represent incidence and distribution of these sequences across genomes.

