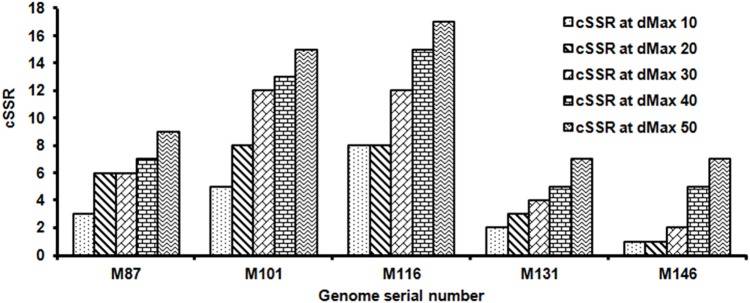
FIGURE 7.
Frequency of cSSR in relation to varying dMAX (10–50) across five randomly selected Mycobacteriophage genomes. A higher cSSR incidence with increasing dMAX in the genomes is along expected lines but the non-linearity of the increase across species is suggestive of genome specific clustering of SSRs.

