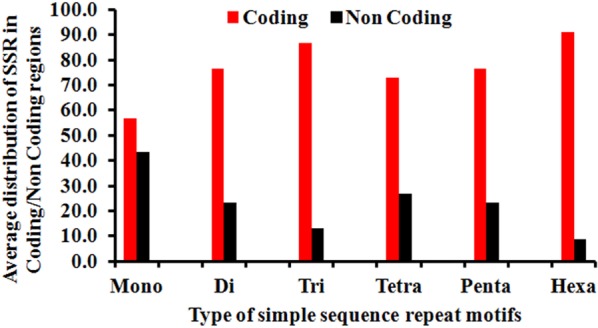
FIGURE 9.

Differential distribution of individual SSR (%) from Mono to Hexanucleotide in coding vs. non-coding regions. The figure very clearly illustrates the extreme bias of hexanucleotide repeats incidence in coding regions. This was followed by trinucleotide repeats whereas the least bias was observed in case of mononucleitide repeats.
