Figure 1.
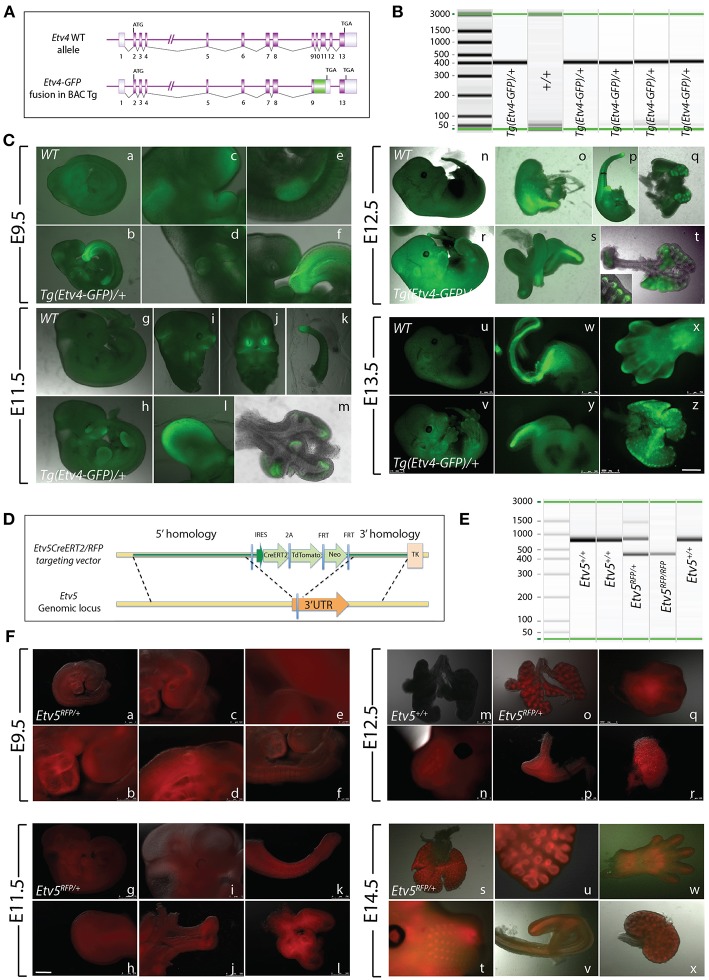
Early embryonic expression of ETV4-GFP and ETV5-RFP (A) Tg(Etv4-GFP) genetic construct. (B) Genotype detecting the Tg(Etv4-GFP) transgene at ~400 bp. (C) ETV4-GFP expression pattern in various embryonic organs at E9.5 (a–f), E11.5 (g–m), E12.5 (n–t), and E13.5 (u–z). See text for details. Note the increased expression of ETV4-GFP in the distal tips of the lung (see inset in “t,” and “z”). Scale bar: (a,b,g,h,n,r,u,v) 2.5 mm; (c–f,i–l,o–q,s,y) 500 μm; (w,x) 750 μm; (t,m,z) 1,000 μm. (D) Etv5RFP genetic construct. (E) Genotype detecting the Etv5RFP transgene at ~450 bp and the wild type Etv5 at ~827 bp. (F) ETV5-RFP expression pattern in various embryonic organs at E9.5 (a–f), E11.5 (g–l), E12.5 (o–r), and E14.5 (s–x). Please note that the Etv5+/+ lungs do not show any autofluorescence (Figure 1Fm). See text for details. Note the differential expression level of ETV5-RFP in the distal lung epithelium vs. the proximal conducting airways (see “o” and “s”). Scale bar: (a,i,n,t) 1 mm; (b) 250 μm; (c,d,f,h,j,l,m,o,q-s,u,w,x) 500 μm; (e) 100 μm; (g) 2.5 mm; (k,p,v) 750 μm.

