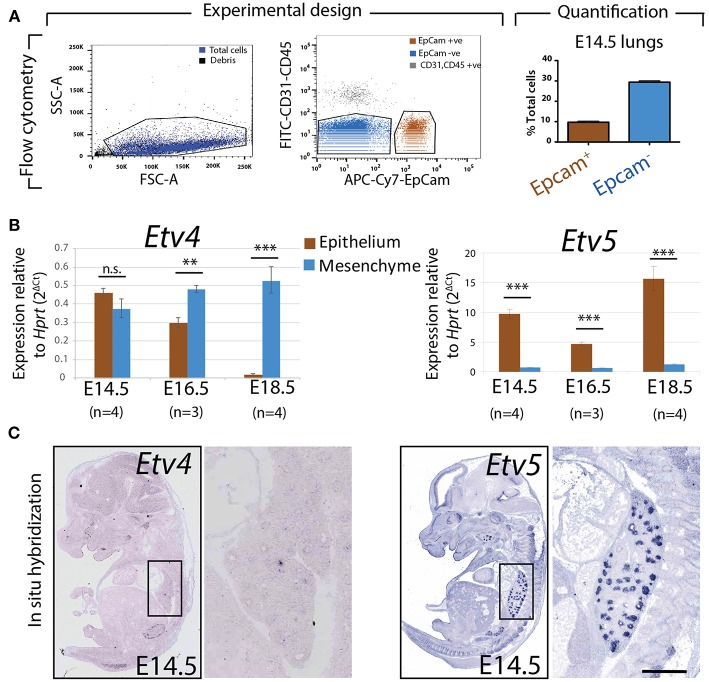
Figure 2.
Expression of Etv4 and Etv5 in isolated embryonic lung epithelium and mesenchyme (A) Experimental design for the FACS-based isolation of embryonic lung epithelial and mesenchymal cells at E14.5 (n = 4; 44.88 ± 17.54 ng/μl RNA from epithelial cells, 64.70 ± 18.10 ng/μl RNA from mesenchymal cells), E16.5 (n = 3; 16.38 ± 5.69 ng/μl RNA from epithelial cells, 75.18 ± 13.79 ng/μl RNA from mesenchymal cells), and E18.5 (n = 4; 28.77 ± 3.06 ng/μl RNA from epithelial cells, 44.89 ± 15.30 ng/μl RNA from mesenchymal cells). Approximately 10 and 30% of the cells in E14.5 lungs were epithelial and mesenchymal, respectively. (B) RT-qPCR for Etv4 and Etv5 in isolated epithelial and mesenchymal cells. Note the different scales of the y-axis between Etv4 and Etv5 graphs. (Data are presented as geometric mean ± SE; n.s. = not significant, **p < 0.01, ***p < 0.001). (C) In situ hybridization from the genepaint database showing the expression of Etv4 and Etv5 in E14.5 embryos.

