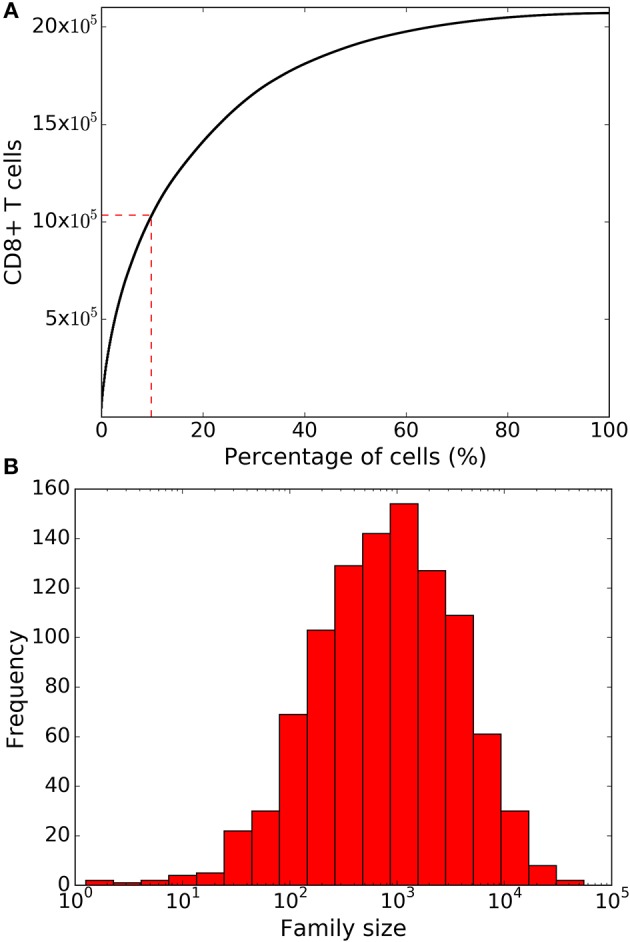
Figure 2.

Family size distributions generated by the basic stochastic inheritance model. Panel (A) depicts the cumulative family size distribution, i.e., the percentage of naïve CD8+ T cells (x-axis) and the corresponding cumulative number of CD8+ T cells present on day 8 (y-axis). The CD8+ T cell families on the x-axis are ordered by their size on day 8 (with the largest family on the left). The dashed red lines represent the fraction of families that constitute 50% of the total response. Panel (B) shows the frequency distribution of family sizes on day 8, which reveals that some families contribute more than 104 cells to the total response. These results are based on simulating the clonal expansion of a 1,000 naïve CD8+ T cells.
