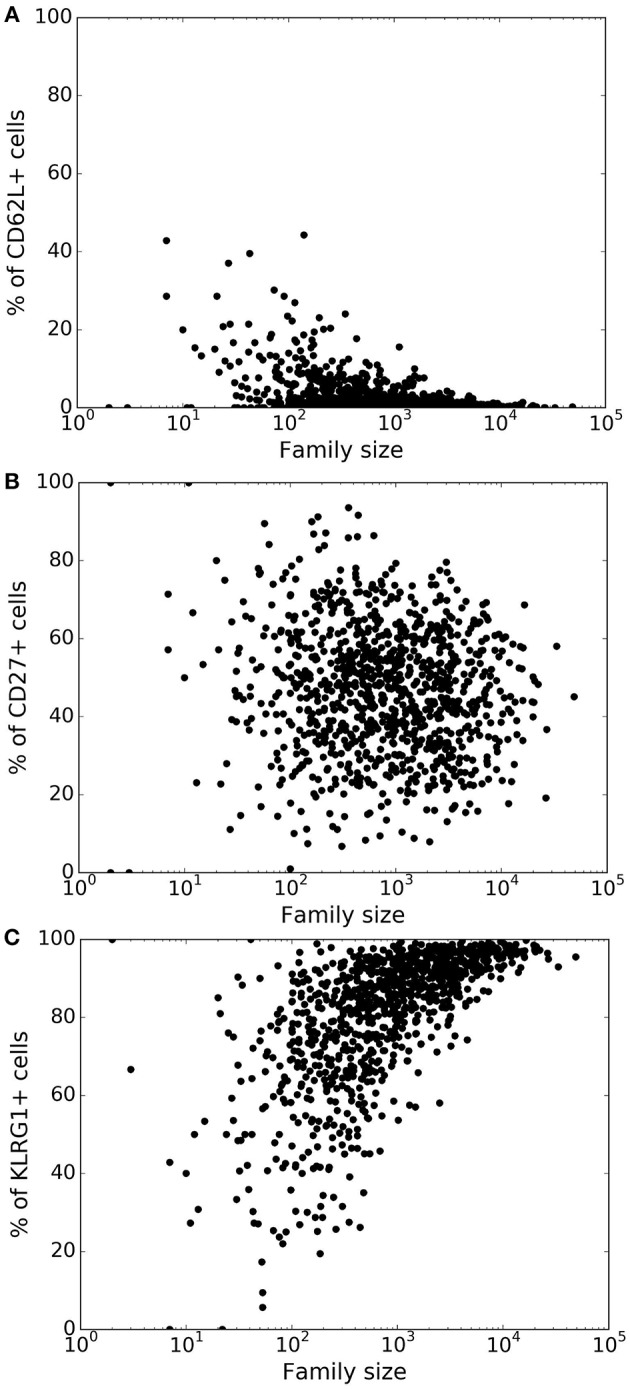
Figure 3.

Variation of the marker distribution as a function of family size in the basic model. The fraction of CD8+ T cells that are positive for CD62L (A), CD27 (B), and KLRG1 (C) markers is shown for each CD8+ T cell family. Each bullet represents one naïve CD8+ T cell family. These results are based on simulating the clonal expansion of a 1,000 naïve CD8+ T cells.
