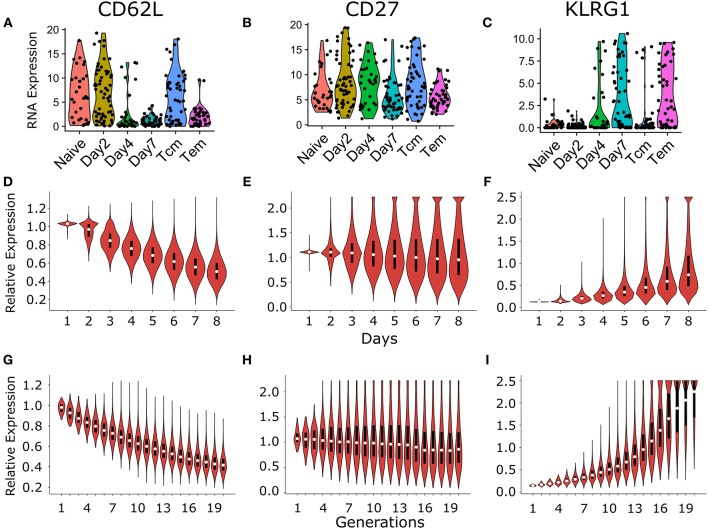
Figure 6.
Comparison of temporal and generational dynamics in heterogenous time of activation model with the publicly available single cell experiment described in Kakaradov et al. (26). RNA expression of different cell surface markers CD62L (A), CD27 (B), and KLRG1 (C), which are commonly used to classify different CD8+ T cell subsets [reanalyzed from (26)]. Briefly, Kakaradov et al. (26) performed single cell RNA sequencing on the following CD8+ T cell populations: naïve; day 2 cells that had undergone their first division (Day2); day 4 cells (Day4); day 7 cells (Day7); day 42 central memory (Tcm); and day 42 effector memory (Tem) cells. The violin plot shows the temporal dynamics of CD62L (D), CD27 (E), and KLRG1 (F) expression distribution in CD8+ T cells. The cells that were alive at the start of each day were considered for the calculation of the individual expression distribution. The violin plot shows the dynamics of CD62L (G), CD27 (H), and KLRG1 (I) expression distribution per generation of CD8+ T cells. The marker expression levels in the model were normalized with the expression threshold used to determine marker positivity in Figures 3, 5 (see section 4). These results are based on simulating the clonal expansion of a 1,000 naïve CD8+ T cells.

