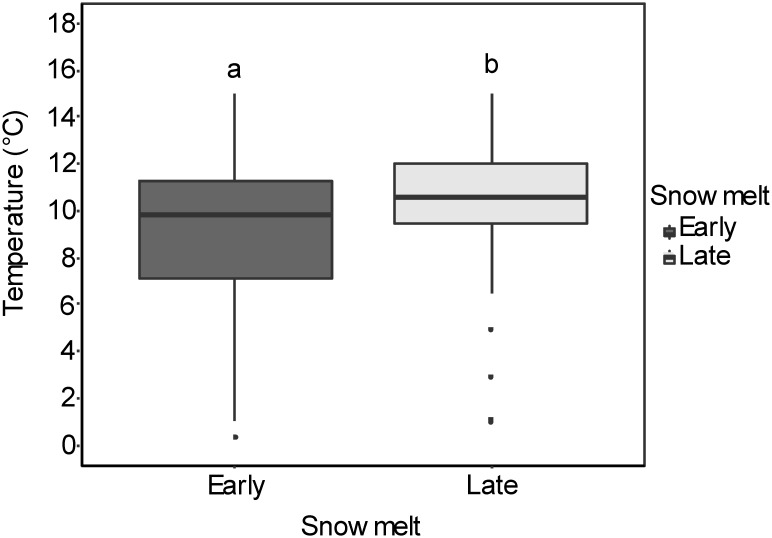
FIGURE 3.
Box-whisker plots for soil temperatures in early and late snowmelt areas (number of sites = 4) for 6 weeks from melt-out date in 2016. The boxes comprise the 25th and 75th percentile with the upper and lower whiskers extending from the hinge to the upper and lower 1.5 inter-quartile ranges, respectively. The different letters indicate significant differences (P < 0.05) between early and late snowmelt areas. Detailed results of linear mixed effect models are given in Supplementary Table S4.

