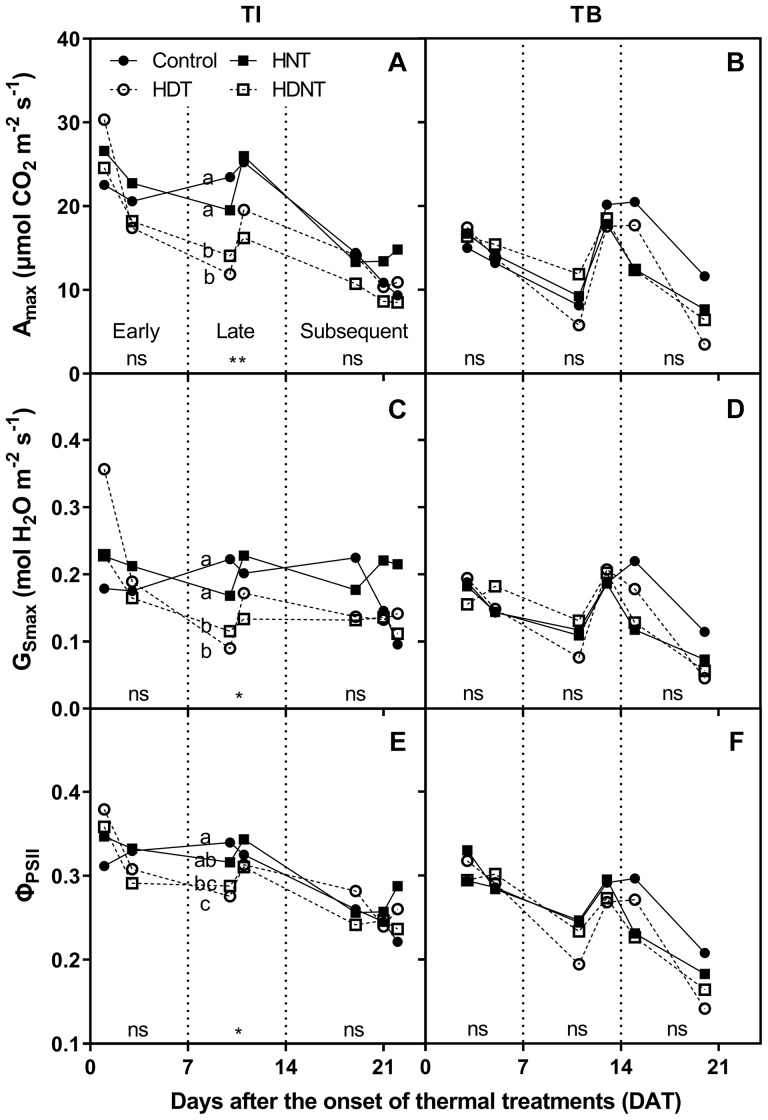
FIGURE 2.
Light-saturated net CO2 assimilation rate (Amax; A,B), stomatal conductance for H2O (GSmax; C,D), and effective quantum yield of photosystem II (ΦPSII; E,F) of the potatoes grown under four different thermal regimes at tuber initiation (TI; A,C,E) and tuber bulking (TB; B,D,F). The vertical dotted lines divided the x-axis to the early, late, and subsequent phases of treatment; ∗p < 0.05, ∗∗p < 0.01, and ns, non-significant, respectively. Different letters within each phase of treatment denote significant differences among the thermal regimes tested by LSD test at p < 0.05. The letters are arranged vertically in the order of control, HNT, HDNT, and HDT.

