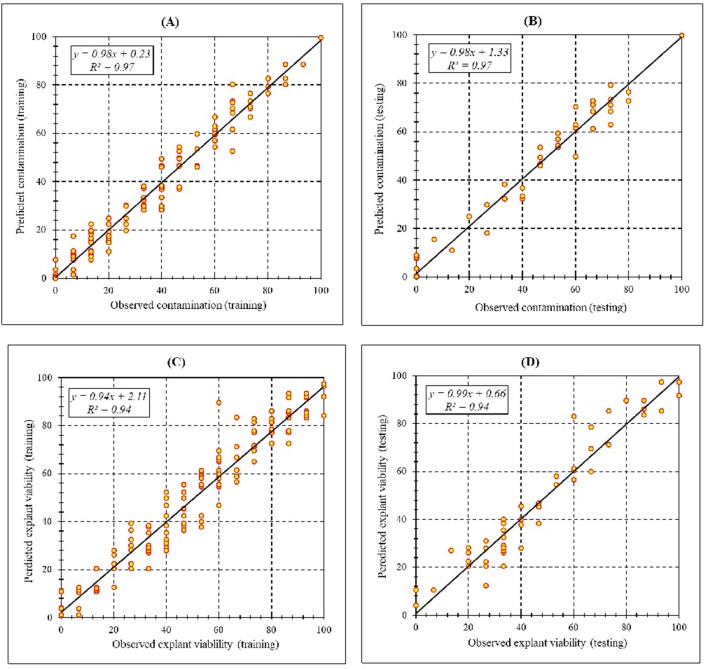
Figure 3.
Scatter plot of model predicted vs. observed values of (A) Training set (n = 165); (B) testing set (n = 54) of contamination frequency, (C) training set (n = 165); (D) testing set (n = 54) of explant viability during in vitro sterilization of chrysanthemum obtained by MLP model. Fitted simple regression line on scatter points was indicated by a solid line.

