Fig. 4.
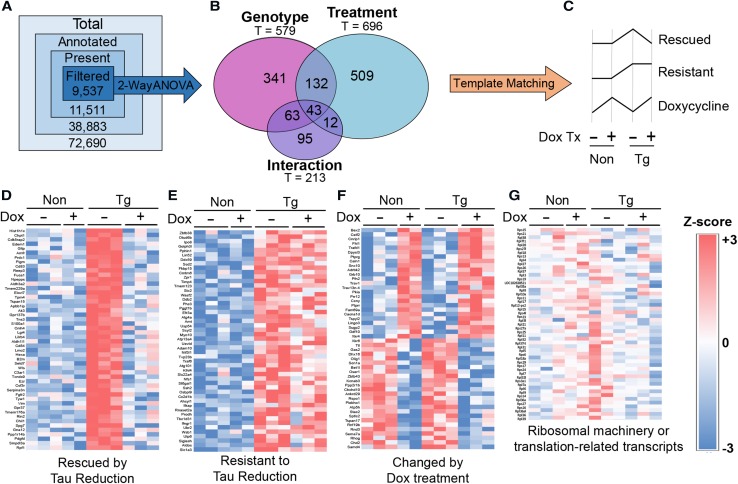
Pathological tau and doxycycline modify transcriptomic profiles into three distinct patterns, but ribosomal profiles do not change. a Filtering strategy of microarray results to identify genes and patterns of differential expression. b Venn diagram showing the distribution of transcripts identified as significant by two-way ANOVA (p ≤ 0.01) across effects of genotype, treatment, and the interaction between both variables. c Differential expression patterns enriched beyond the levels expected by random chance. d–f Heat maps representing intensities (log2) of transcripts matched to statistically significantly patterns of differential expression. g Heat map representing intensities (log2) of transcripts coding for proteins related to translation including ribosomal proteins.

