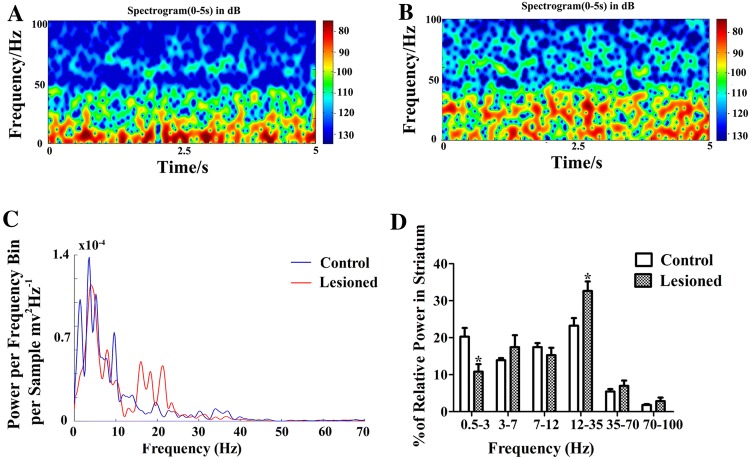
Fig. 4.
LFP activity in the DS during rest episodes. A, B Representative scalograms showing time-frequency plots of LFP power in control (A) and lesioned (B) rats. C Averaged Welch power spectra across frequency in both control and lesioned groups. D Mean relative LFP power in the DS in the series of frequency ranges 0.5 Hz–3 Hz, 3 Hz–7 Hz, 7 Hz–12 Hz, 12 Hz–35 Hz, and 70 Hz–100 Hz in control (n = 7) and lesioned (n = 7) rats (*P < 0.05).

