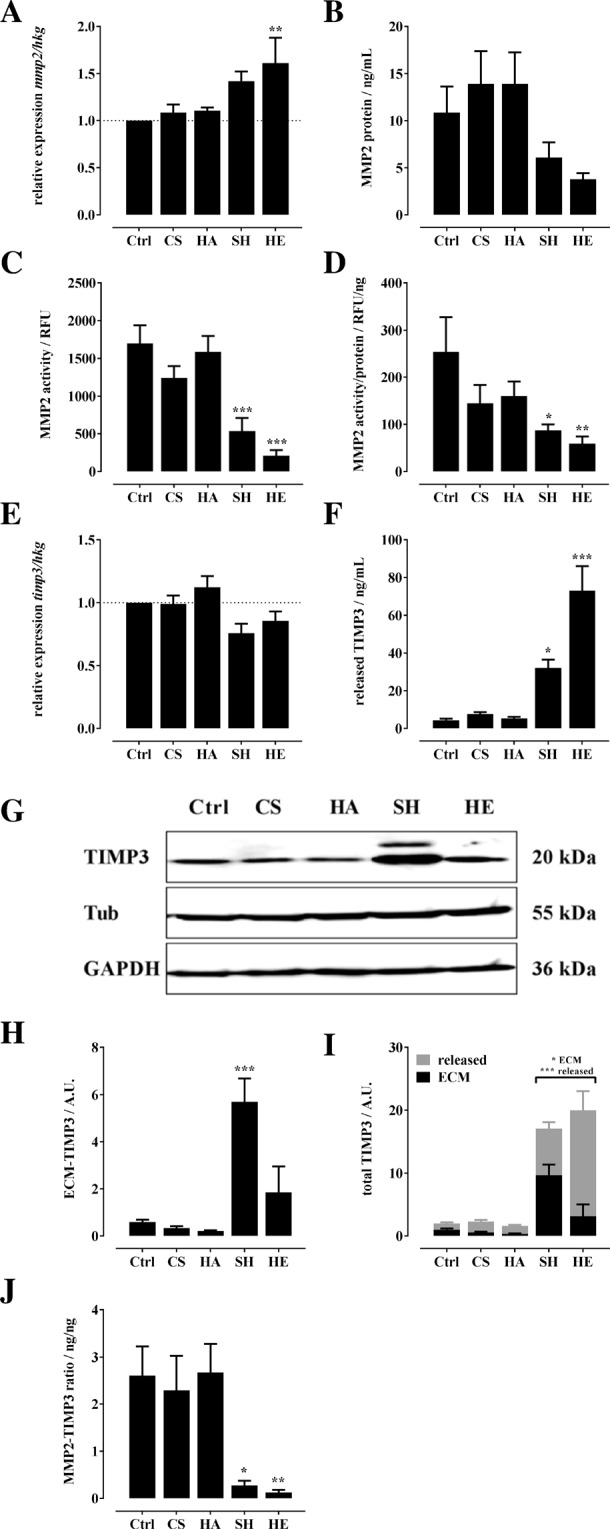
Figure 1.

Influence of CS, HA, SH, and HE on MMP2 and TIMP3 formation and MMP2 activity in hBMSC. 7,000 hBMSC/cm2 were plated in basic medium and treated with CS, HA, SH, and HE (200 µg/mL each). At day 22 after plating cells and conditioned medium were analyzed. (A) mmp2 expression was assessed by qPCR, normalized to the expression of the house-keeping genes (hkg) gapdh, β-actin, and rps26, and related to untreated control (Ctrl, set to 1) using the comparative quantitation method. Conditioned medium of hBMSC was analyzed for MMP2 protein content using commercially MMP2 ELISA Kit (B) and for MMP2 enzyme activity with fluorogenic peptide (MCA-Pro-Leu-Ala-Nva-Dpa-Ala-Arg-NH2) as a substrate (C). (D) The relative MMP2 activity per MMP2 protein amount was calculated from fluorescence signals (MMP2 activity) and ELISA data (MMP2 protein). (E) timp3 expression was assessed by qPCR as described. (F) TIMP3 protein amount released into the conditioned medium was determined by ELISA. TIMP3 protein in the pericellular environment of hBMSC was analyzed by Western blotting with chemiluminescence detection. (G) shows a representative Western blot (cropped), according full-length blots presented in Supplemental Fig. S3. The chemiluminescence signals of four independent Western blots were quantified densitometrically and normalized to GAPDH and β-tubulin (Tub) as internal loading controls (H). (I) shows the total TIMP3 content related to Ctrl and the distribution of TIMP3 calculated from Western blot data (pericellular, ECM-associated TIMP3) and ELISA data (released TIMP3). The ratio of released MMP2 protein to released TIMP3 is shown in (J). The results are presented as mean ± SEM. Significant differences of treatment vs. Ctrl were analyzed by one-way ANOVA/Bonferroni’s post-test (A–F,H,J), and of SH vs. HE two-way ANOVA/Bonferroni’s post-test (I) and are indicated with *(p < 0.05), **(p < 0.01) and ***(p < 0.001), n = 4.
