Figure 2.
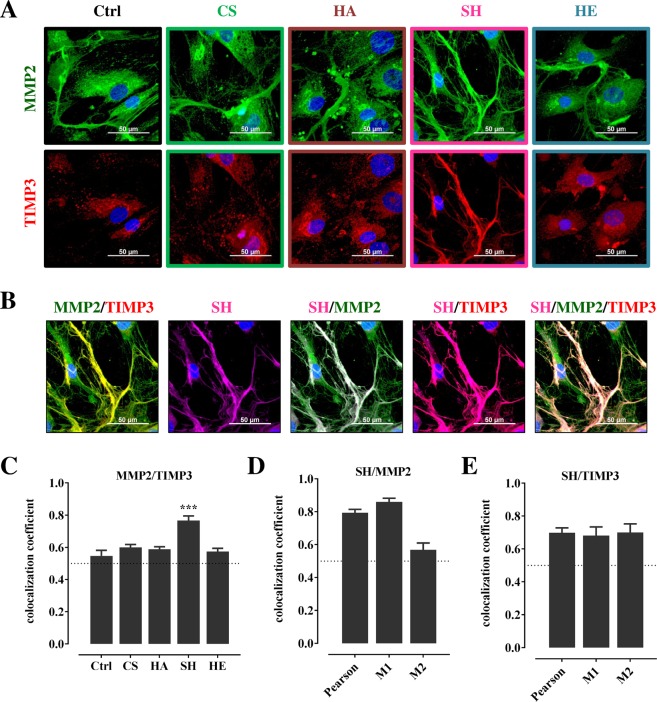
Immunofluorescence staining and colocalization analysis of MMP2 and TIMP3, and of SH with MMP2 and TIMP3. 7,000 hBMSC/cm2 were plated in basic medium and treated with CS, HA, SH, and HE (200 µg/mL each) (A) or with ATTO655-SH (violet) (B). At day 8 after plating cells were fixed with paraformaldehyde and stained for MMP2 (green), TIMP3 (red), and nuclei (blue); scale bars 50 µm (A,B). (B) Images in line from left to right show merged MMP2/TIMP3 (yellow), SH (violet), merged SH/MMP2 (white), merged SH/TIMP3 (purple), and merged SH/MMP2/TIMP3 (pale pink). The extent of colocalization of MMP2 with TIMP3 (C) (according to images in A) and of SH with either MMP2 (D) or TIMP3 (E) (according to images in B) was calculated as described. Pearson correlation coefficient (summarized signal) values >0.5 (dotted line) indicate a high probability that pixels of both channels are overlay. Manders’ coefficients M1 and M2 (M1 indicates the overlap of SH signal (violet channel) with MMP2 signal (green channel) (D,E). Values are given as mean ± SEM; significant differences of treatment vs. Ctrl were analyzed by one-way ANOVA/Bonferroni’s post-test and are indicated with ***(p < 0.001), n = 8.

