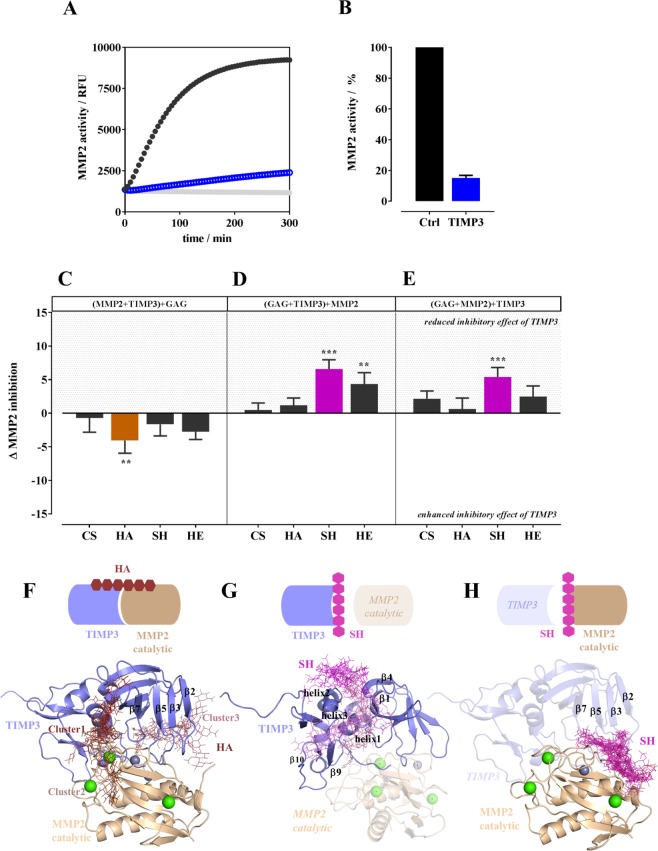
Figure 4.
Influence of CS, HA, SH, and HE on TIMP3-induced MMP2 inhibition. MMP2 enzyme activity was determined with rhMMP2 (100 ng/mL) and 50 µM fluorogenic peptide (MCA-Pro-Leu-Ala-Nva-Dpa-Ala-Arg-NH2) as a substrate. Kinetic measurement was performed for 5 h without TIMP3 (black curve) and in the presence of 40 ng rhTIMP3/mL (A, blue curve); blanks are given in light grey. TIMP3-induced inhibition of MMP2 activity after 5 h (endpoint of kinetic measurement) is given in percent of MMP2 activity (B). In the presence of GAG (200 µg/mL) the activity assay was performed in different sequence: either MMP2 and TIMP3 or TIMP3 and GAG or MMP2 and GAG (given in parenthesis) were incubated for 30 min before adding the third component. (C–E) show how the sequence of incubating the assay components influenced the inhibitory effect of TIMP3 on MMP2 activity. The results are presented as mean ± SEM. Significant differences of treatment vs. control were analyzed by one-way ANOVA/Bonferroni’s post-test and are indicated with *(p < 0.05), **(p < 0.01), and ***(p < 0.001), n = 4. (F–H) Schematic representation of molecular recognition of GAG to MMP2/TIMP3 complex, TIMP3 and MMP2, respectively, and corresponding docking results using Autodock3 and DBSCAN clustering. MMP2 catalytic domain (PDB ID 1QIB (2.8 Å)) and TIMP3 model are shown in pale and blue cartoon, respectively. TIMP3 model in (H) and MMP2 in (G) are shown in blue and pale transparency, respectively, just for illustrative purposes, although not taken into account for docking calculations. Calcium and zinc ions are shown in green and grey spheres, respectively. Different clusters of GAG are shown in sticks with color gradient: SH (G,H, pink) and HA (F, brown). The cartoons above illustrate in a schematic manner the recognition of GAG to MMP2/TIMP3 complex, TIMP3 and MMP2 predicted by molecular modeling.

