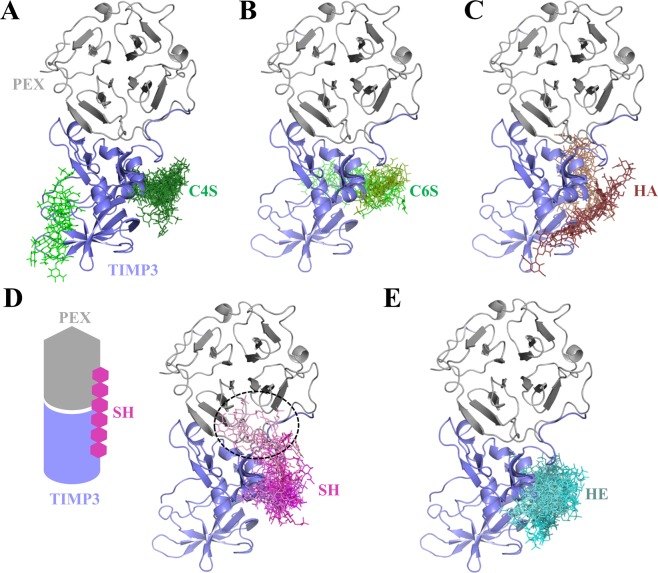
Figure 6.
Molecular modeling of GAG in complex with proMMP2(PEX)/TIMP3. Docking results using Autodock3 and DBSCAN clustering of GAG (sticks) to PEX domain of proMMP2 (grey cartoon) (PDB ID 1GXD (3.1 Å)) in complex with TIMP3 model (blue cartoon). Different clusters of GAG are highlighted in gradient colors: (A) C4S (green) (B) C6S (green), (C) HA (brown), (D) SH (pink) and (E) HE (teal). The cartoon illustrates the molecular bridging of PEX and TIMP3 by SH (discontinuous circle) (D).

