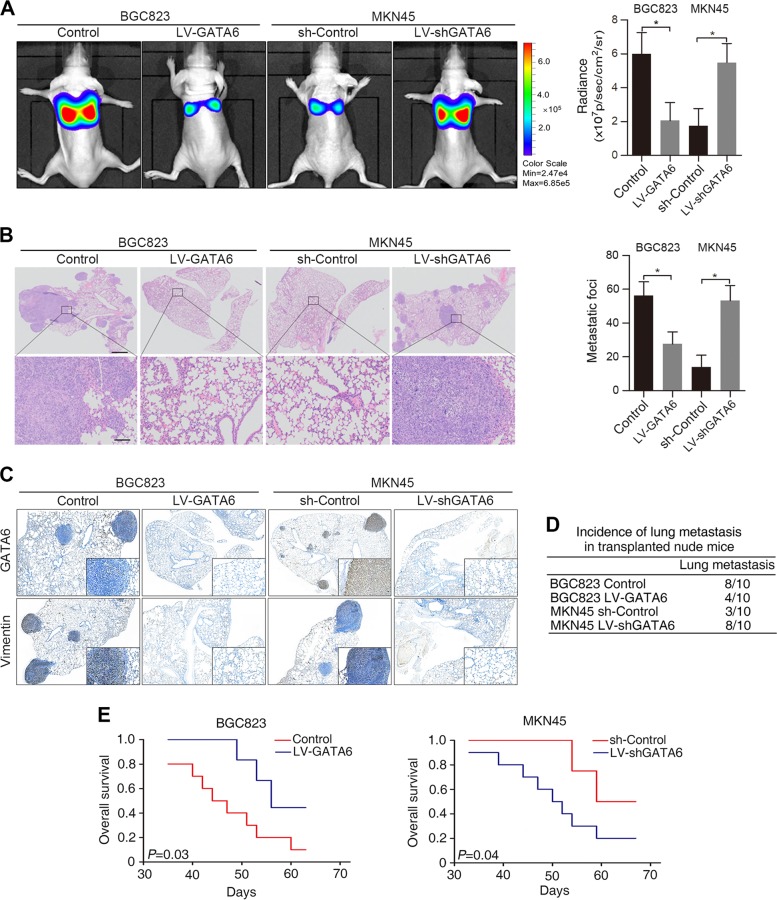
Fig. 3. GATA6 suppresses GC cell metastasis in vivo.
A Representative bioluminescence images of the different groups are shown at 8 weeks after tail vein injection (left). The radiance was collected and calculated (right). B Representative hematoxylin and eosin (H&E) staining images of lung tissue sections from different groups (left). The number of lung metastatic foci was calculated (right). Scale bars: 200 μm (top) and 50 μm (bottom). C Representative human GATA6 and Vimentin IHC staining of whole lung sections. Bars: (main) 200 µm; (insets) 50 µm. D Incidences of lung metastases of each group. E OS time of the nude mice in each group. *p < 0.05

