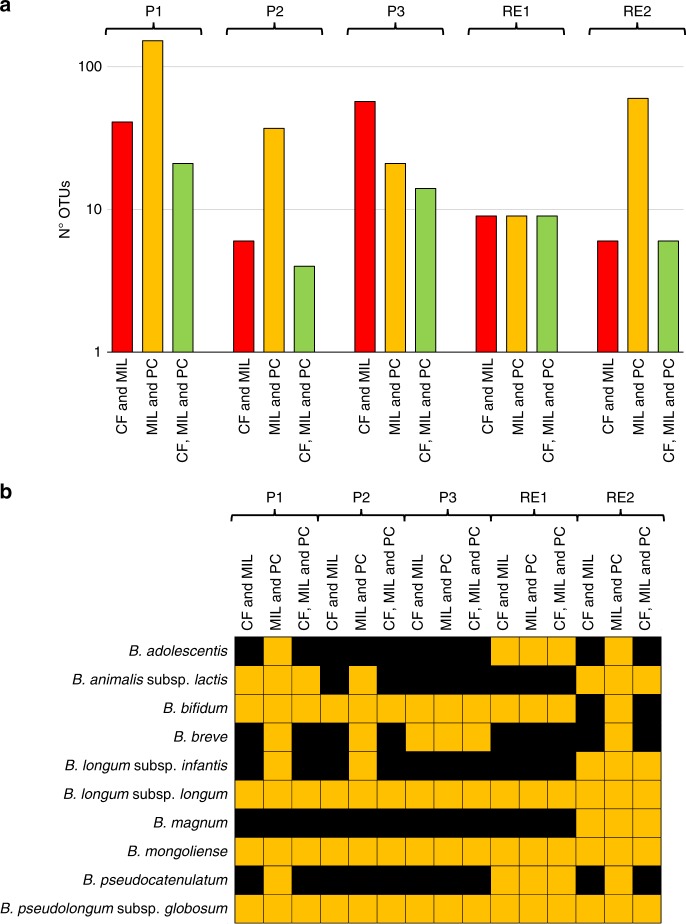
Fig. 3.
Bifidobacterial ITS-based profiling of CF, MIL, and PC samples. Panel a shows a bar plot displaying the number of OTUs shared between multiple samples collected from the same cheese making site. Panel b illustrates by means of a heat map the bifidobacterial taxa for which OTUs were found to be shared with a prevalence of >70% between CF, MIL, and PC samples of the same cheese making site. Source data are provided as a Source Data file

