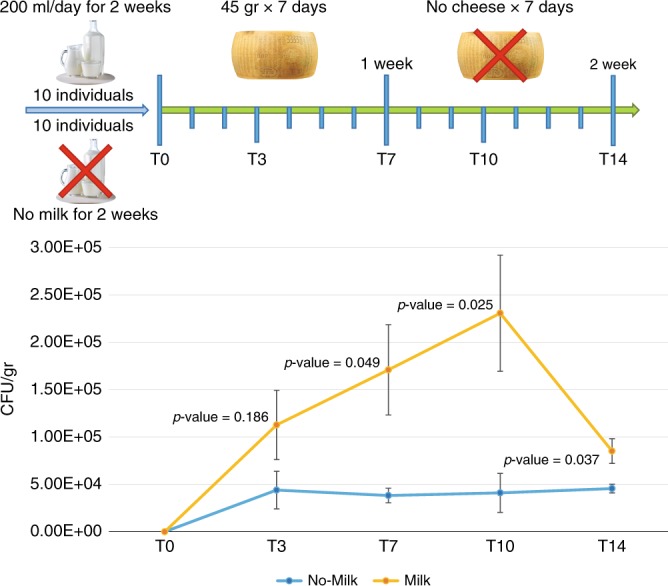
Fig. 5.

Evaluation of the performance of B. mongoliense BMONG18 in achieving human gut colonization and persistence. The graph shows the average abundance of B. mongoliense BMONG18 observed in the enrolled 10 Milk and 10 No-Milk individuals at multiple time points, as described in the study plan schematized in the upper part of the image. Error bars represent the standard deviation. P-values obtained from Student t test between Milk and No-Milk individuals are reported in the graph for each sampling point. Source data are provided as a Source Data file
