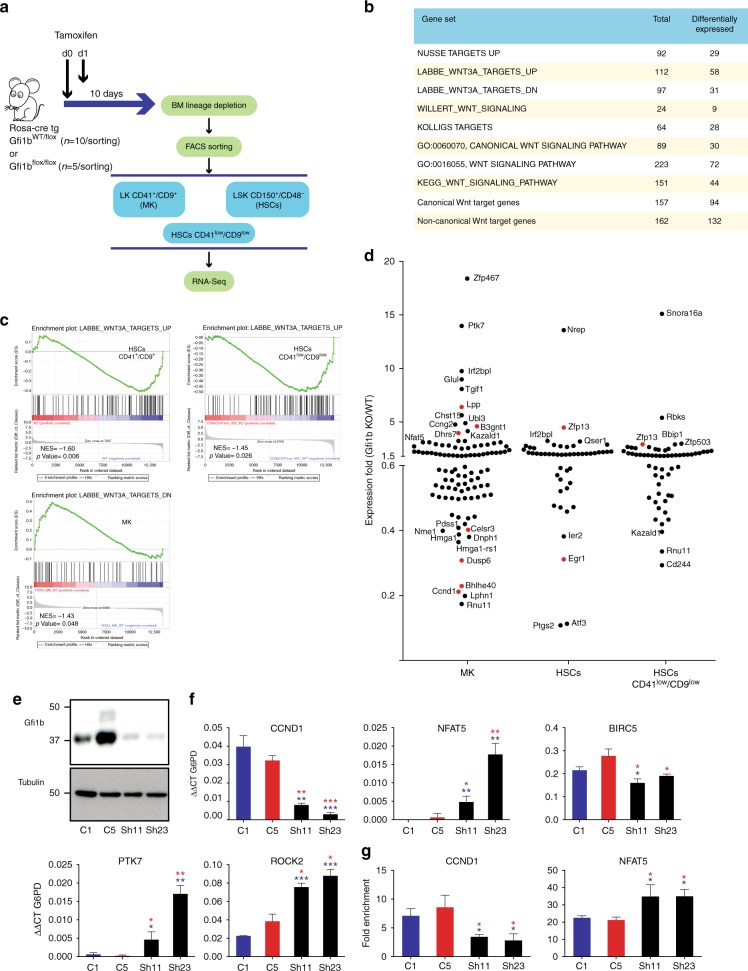
Fig. 6.
Deregulation of Wnt/β-catenin target gene expression in Gfi1b-deficient MKs and HSCs. a Gene expression analysis was done on sorted Gfi1b WT/KO MKs, HSCs and HSCs CD41low/CD9low as indicated. b, c Gene set enrichment analysis (GSEA) of RNA-seq data from the sorted cells using published Wnt related gene sets (see Supplementary Table 2 for gene set references). d RNA-seq expression analysis of Gfi1b/β-catenin co-occupied genes (based on published ChIP-seq data) in the three Gfi1b WT/KO populations. Genes indicated in red also have peaks for LSD1 at their promoter. e GFI1B expression in two independent K562-derived cell lines stably expressing a scrambled control shRNA (C1, C5) and two lines expressing a GFI1B specific shRNA (Sh11, Sh23). f Expression analysis of Wnt target genes by RT-PCR in GFI1B shRNA KD and scramble shRNA stable K562 clones. g Enrichment of acetylated H3K9 at GFI1B/β-catenin target gene promoters by ChIP-qPCR in GFI1B shRNA KD and scramble shRNA stable K562 clones. (*P < 0.05, **P < 0.001, ***P < 0.0001 on a Welch corrected t-test compared to C1 (in blue) or C5 (in red), error bars show s.d, n = 3 technical replicates)

