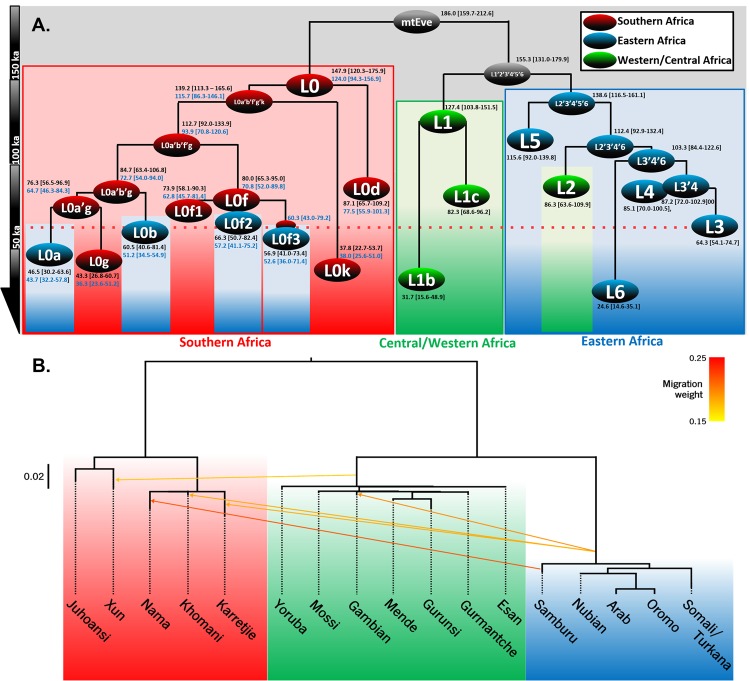
Figure 1.
Genetic structure of Africa using mitochondrial DNA and genome-wide data. (A) Schematic African mtDNA tree, scaled using maximum likelihood and a time-dependent molecular clock for whole-mtDNA genomes (age estimates in black). Age estimates in blue in L0 were obtained using an ancient DNA calibration with BEAST. (B) Maximum-likelihood population tree and admixture events inferred by TreeMix, with five inferred migration edges. The colour of the migration arrows indicates different migration weights. The branch lengths are proportional to the extent of genetic drift that has occurred in each population.

