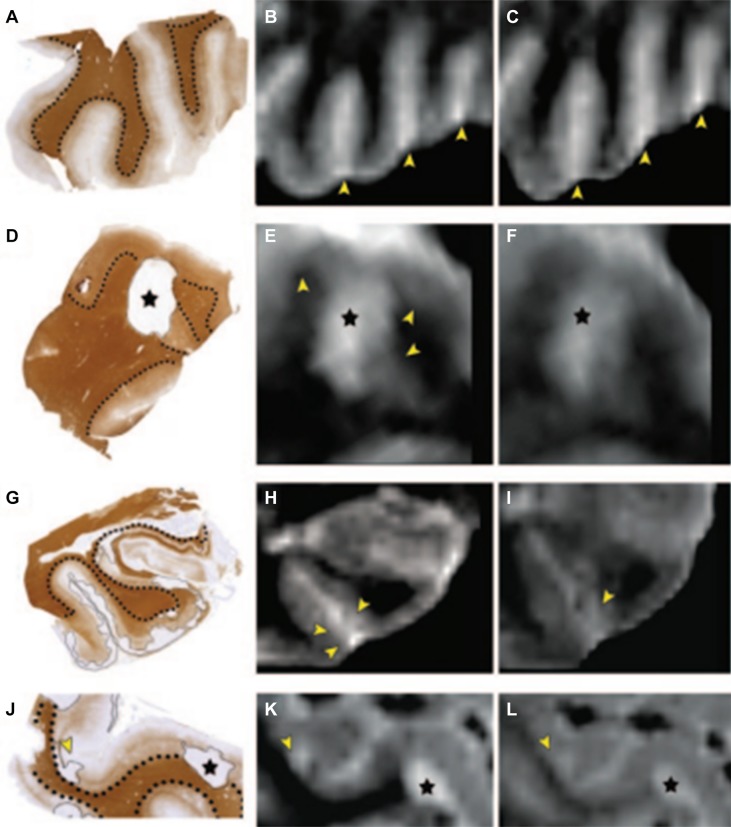
Fig. 2.
Examples of postmortem MRI at 1.5T, with corresponding histopathology. A, D, G, J Tissue sections stained for proteolipid protein; dotted lines indicate borders between white and gray matter; cortical lesions are encircled by thin black lines. B, E, H, K Postmortem 3D double inversion recovery (DIR) images corresponding to the tissue sections. C, F, I, L Corresponding 3D fluid-attenuated inversion recovery (FLAIR) images. A–C Multiple sclerosis cortex with rather inhomogeneous signal intensity on MRI, but without any demyelinated lesions. The bright signals indicated by the arrowheads (B, C) are caused by blood and other fluid within the sulci, which should not be mistaken for subpial (type III) cortical pathology. D–F Mixed gray-white matter (type I) lesion (asterisk), which is seen on both 3D DIR and 3D FLAIR images. However, the gray matter border (arrowheads in E) is often easier to identify on 3D DIR (E) than on 3D FLAIR (F). G–I Subpial (type III) cortical lesions (indicated by thin line in G and arrowheads in H and I) are slightly more conspicuous on 3D DIR (H) than on 3D FLAIR (I). J–L Mixed gray-white matter (type I) lesion (asterisks). Arrowheads in J–L: an intracortical lesion, which was prospectively scored on 3D DIR (K) and only retrospectively (i.e., with knowledge of histopathology) on 3D FLAIR (L).
Reprinted from Seewann et al. [28] with permission from Wolters Kluwer Health

