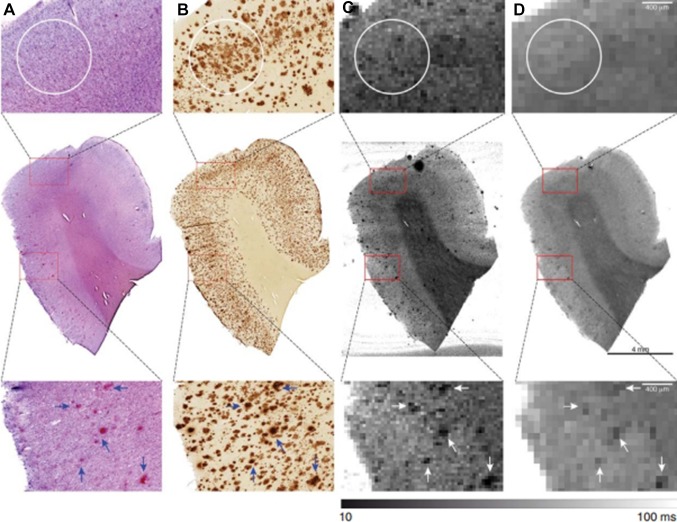
Fig. 3.
Matching of 7T MRI and Aβ histology. Co-registration of (A) Congo Red (CR) and (B) Aβ staining with corresponding quantitative (C) T2* and (D) T2 maps. No signal decrease was observed corresponding to the outline of areas with Aβ lacking CR positivity (white circles). In contrast, as an example, several but not all amyloid plaques highlighted by the presence of both CR and Aβ clearly resulted in hypo-intensities on the corresponding MR images (arrows).
Reprinted from Nabuurs et al. [38] with permission from IOS Press.

