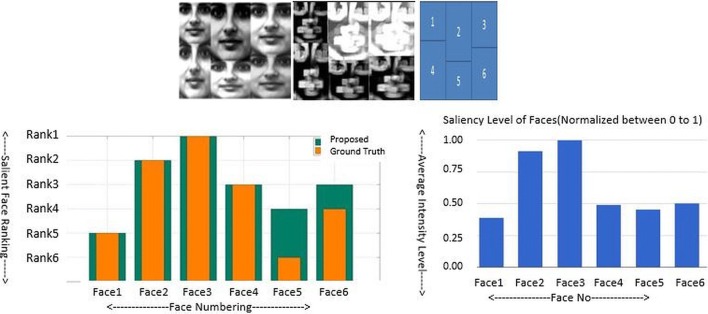
Fig. 18.
Top Row—Left: input image, Middle: proposed saliency map, Right: face numbering. Bottom Row—Left: bar graph using proposed method (highlighted in green) and based on volunteers perception or ground truth (highlighted in orange colour), Right: intensity bar graph of generated saliency map. (Color figure online)

