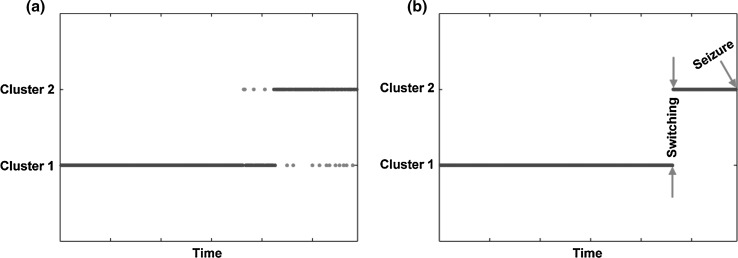
Fig. 1.
Temporal clustering of EEG networks in the interictal and preictal states. a Clustering before adaptive median filtering and b clustering after adaptive median filtering. On the x-axis, each point over the 1-h interval denotes a brain network constructed for each 10-s EEG segment. On the y-axis, two clusters (i.e., interictal and preictal) are presented. Both blue and red dots denote the EEG networks constructed of different durations; in particular, red dots in subfigure (a) denote the isolated network points. (Color figure online)

