Figure 7.

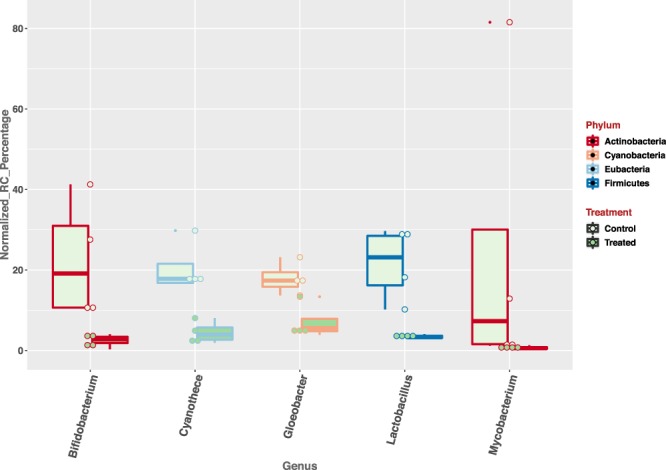
The abundance of 5 genera is significantly higher in the control group (p-value < 0.05), in comparison to the treated group. rRNA sequencing reads mapped to each genera by Kraken were used to calculate the normalized read-counts.

The abundance of 5 genera is significantly higher in the control group (p-value < 0.05), in comparison to the treated group. rRNA sequencing reads mapped to each genera by Kraken were used to calculate the normalized read-counts.