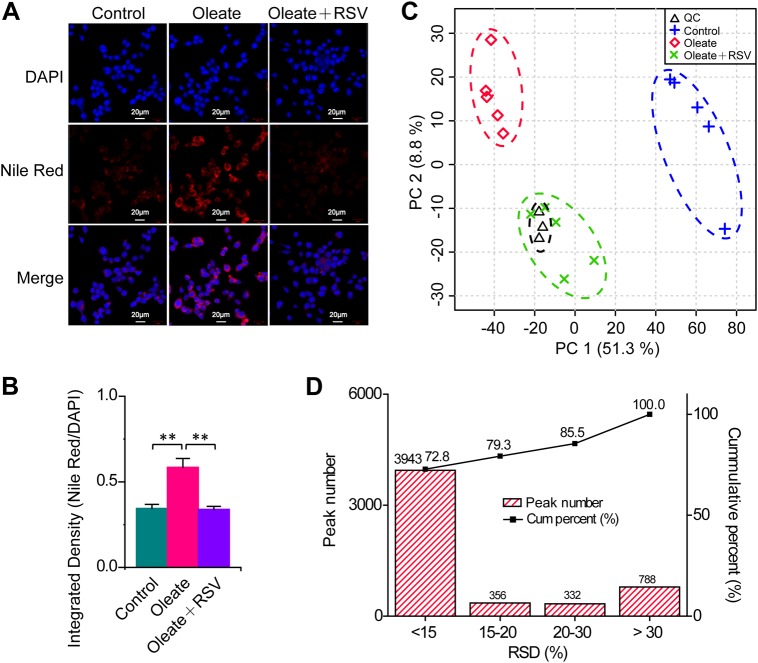
Fig. 1. Significant changes in metabolic profiles related to neutral lipid accumulation in macrophages.
a Representative Nile red staining of macrophages. b Quantification of lipid changes. Data were presented as the mean + SD. n = 8 per group. **P < 0.01, independent samples t-test. c Changes in metabolic profiles of macrophages treated with oleate and RSV. n = 5, 5, 5, and 3 in the control, oleate, oleate + RSV and QC (quality control) groups, respectively. d Relative standard deviation (RSD) distribution of ion peaks in 3 QC samples

