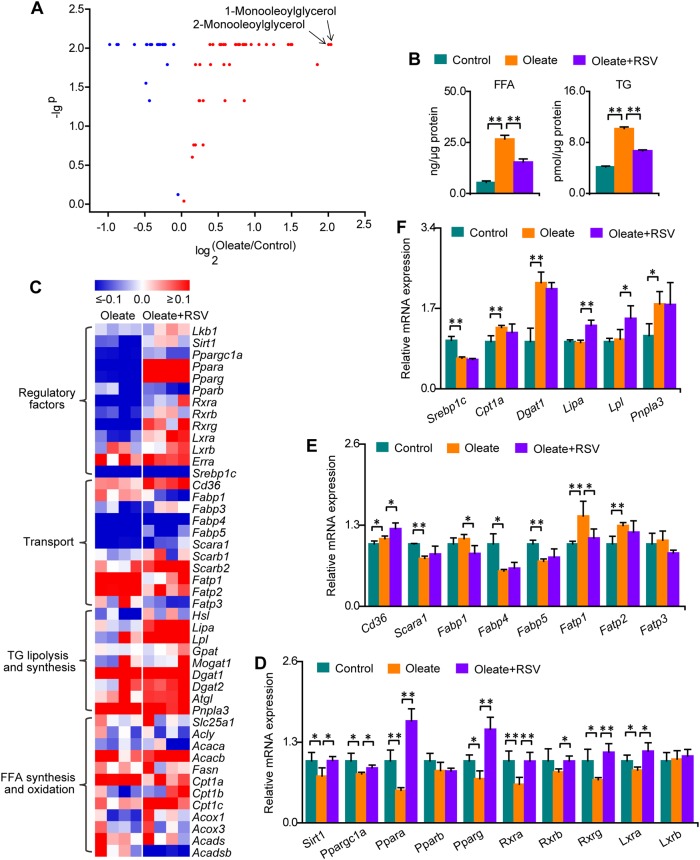
Fig. 5. Oleate induces total FFA and TG accumulation and significant changes in relevant lipid signaling.
Columns represent the mean + SD. *P < 0.05, **P < 0.01, independent samples t-test. a Volcano plot of metabolic changes in macrophages treated with oleate. n = 5 per group. b Changes in FFAs and TGs in macrophages treated with oleate. n = 3 per group. c Heat map of changes in the mRNA expression of genes related to TG metabolism in macrophages treated with oleate and RSV. The mRNA expression levels of genes in the oleate and oleate + RSV groups were divided by the average mRNA expression in the control group, and the base 10 logarithm was taken. n = 4 per group. d Changes in the mRNA expression of genes related to PPAR signaling. n = 4 per group. e Changes in the mRNA expression of genes related to FFA and TG transport. n = 4 per group. f Changes in the mRNA expression of genes related to the synthesis, lipolysis, and oxidation of FFAs and TGs. n = 4 per group

