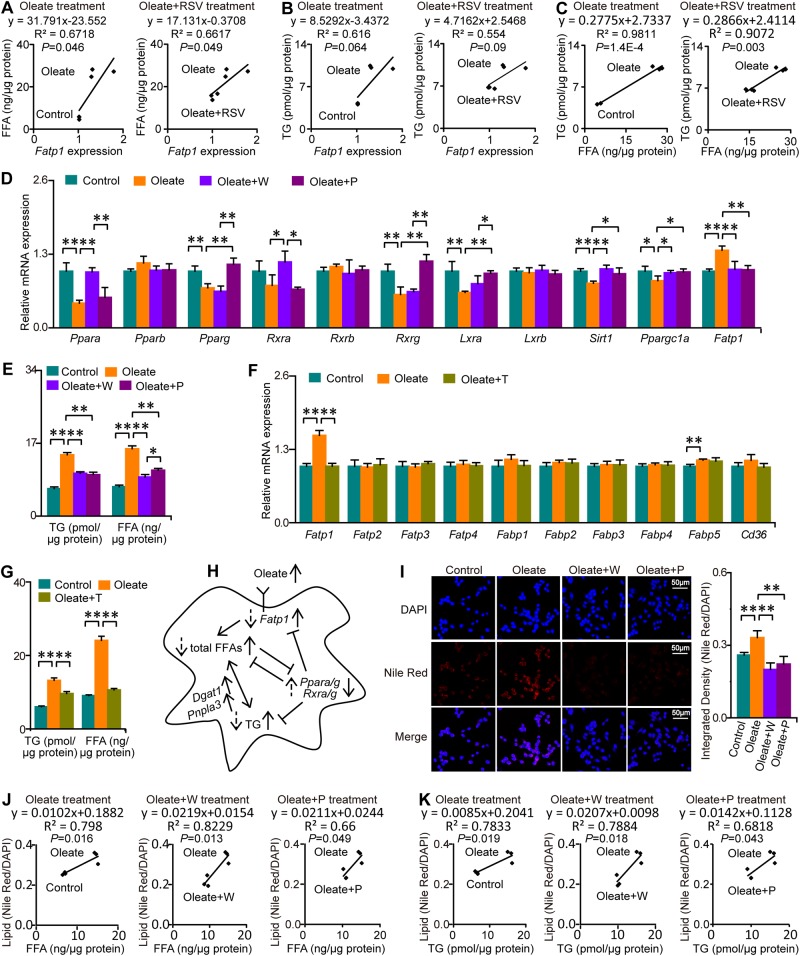
Fig. 6. PPARα and PPARγ activation attenuates total FFA and TG accumulation in macrophages.
Columns represent the mean + SD. *P < 0.05, **P < 0.01, independent samples t-test. W WY14643, P pioglitazone, T TNFα. a Associations between the levels of Fatp1 expression and total FFAs. n = 3 per group. b Associations between the levels of Fatp1 expression and TGs. n = 3 per group. c Associations between total FFA and TG content. n = 3 per group. d Selective PPARα and PPARγ agonists abolished the oleate-induced suppression of PPAR signaling. n = 4 per group. e Selective PPARα and PPARγ agonists attenuated oleate-induced FFA and TG accumulation. n = 3 per group. f Selective inhibition of FATP1 by TNFα. n = 4 per group. g Selective inhibition of FATP1 attenuated oleate-induced FFA and TG accumulation. n = 3 per group. h Molecular mechanisms by which PPARα and PPARγ attenuate oleate-induced FFA and TG accumulation in macrophages. Solid arrows on the right of terms: upward/downward arrows denote increases/decreases in response to oleate. Dotted arrows on the left of terms: upward/downward arrows denote increases/decreases in response to PPARα and PPARγ agonists. i Selective PPARα and PPARγ agonists abolished oleate-induced neutral lipid accumulation. n = 6–10 per group. j Associations between changes in FFAs and changes in neutral lipids in macrophages treated with oleate, oleate+W and oleate+P (n = 3 per group). k Associations between changes in TGs and changes in neutral lipids in macrophages treated with oleate, oleate+W and oleate+P (n = 3 per group)

