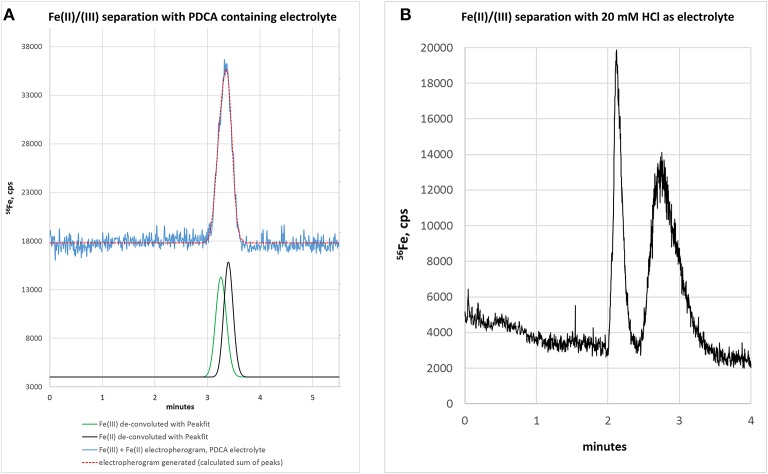
Figure 1.
(A) Electropherogram of a standard mixture [Fe(II) + Fe(III)], each 100 μg/L, with ammonium citrate—PDCA electrolyte. Separation is not achieved. Mathematical peak deconvolution shows that the peak consist of two compounds (green, black) with similar migration times and the calculated sum-peak of both (red) matches the measured signal (blue). For graphical reasons the blue and red lines are plotted with an offset. (B) Electropherogram of Fe(III) and Fe(II) with 20 mM HCl as background electrolyte. Separation is possible but peak focusing is still insufficient. Therefore, sample stacking was planned for the next method development step.

