Figure 1.
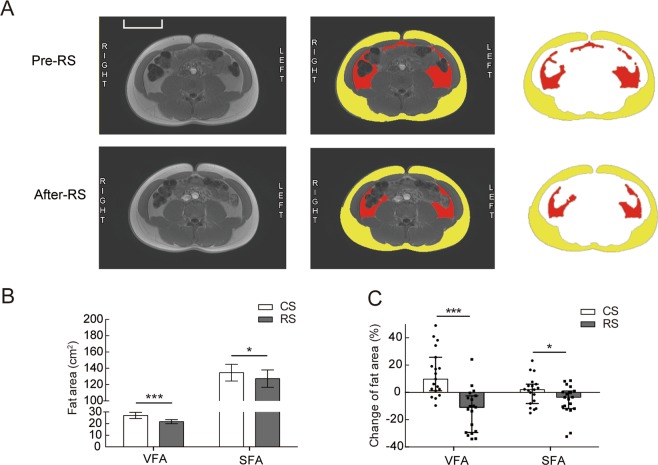
Body composition before and after 4 weeks of RS or CS supplementation in normal-weight subjects. Nineteen normal-weight subjects were followed up for 4 weeks of dietary supplementation with RS or CS in a crossover study. (A) Representative abdominal MRI of the subjects before and after 4 weeks of RS consumption. Raw (left panel) and marked (middle and right panel) MRI at the navel level; yellow delineates the SFA and red delineates the VFA. (B) The SFA and VFA in the participants after a standardized meal following 4 weeks of consumption of RS or CS (n = 19). Data are presented as the mean ± SEM. (C) Changes in the fat area (%) (SFA and VFA) evaluated by MRI in subjects after 4 weeks of CS or RS intake (n = 19). Data are presented as the median (interquartile range), Significance was determined using the GEE model. Scale bar = 10 cm. *p < 0.05, ***p < 0.001.

