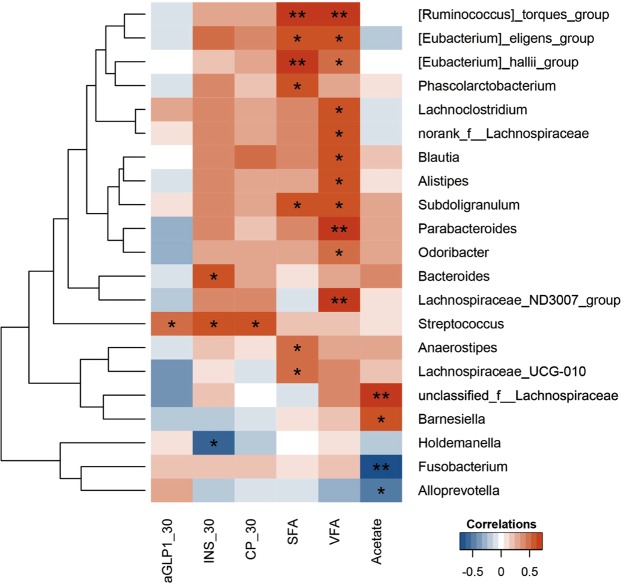
Figure 4.
The correlation heatmap of the baseline gut microbiota with altered host phenotypes and SCFAs. Spearman’s correlations between the abundances of the top 50 most abundant bacterial genera at baseline and the changes in the phenotypes or SCFAs after RS intake were calculated. Blue: negative correlations; red: position correlations. *p < 0.05, **p < 0.01. aGLP1_30: postprandial aGLP-1 at 30 min; INS_30: postprandial insulin at 30 min; CP_30: postprandial C-peptide at 30 min.

