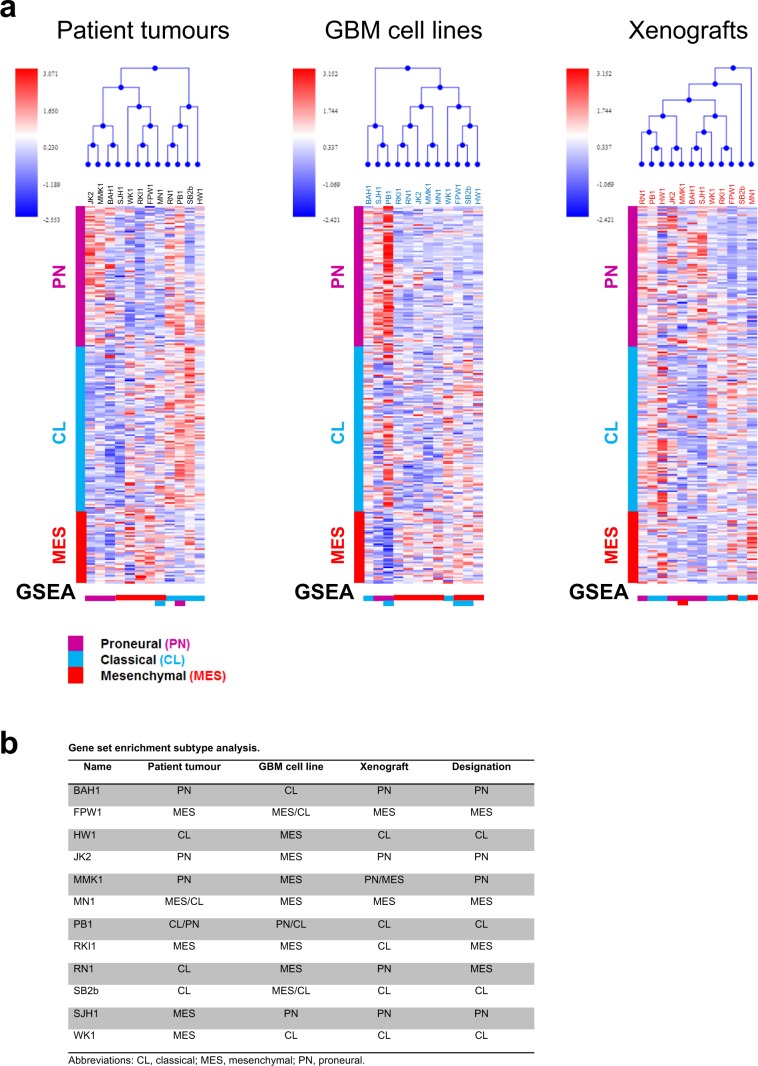
Figure 4.
Molecular subtyping of matched patient tumours, GBM cell lines and xenografts. (a) Hierarchical cluster analysis (top), corresponding heatmaps (middle) and gene set enrichment analysis (GSEA) (bottom) of patient tumours, derived GBM cell lines and matched murine xenografts initiated by the cell lines identifying gene expression patterns characteristic of proneural, classical and mesenchymal GBM. (b) Summary of GSEA results.

