Figure 2.
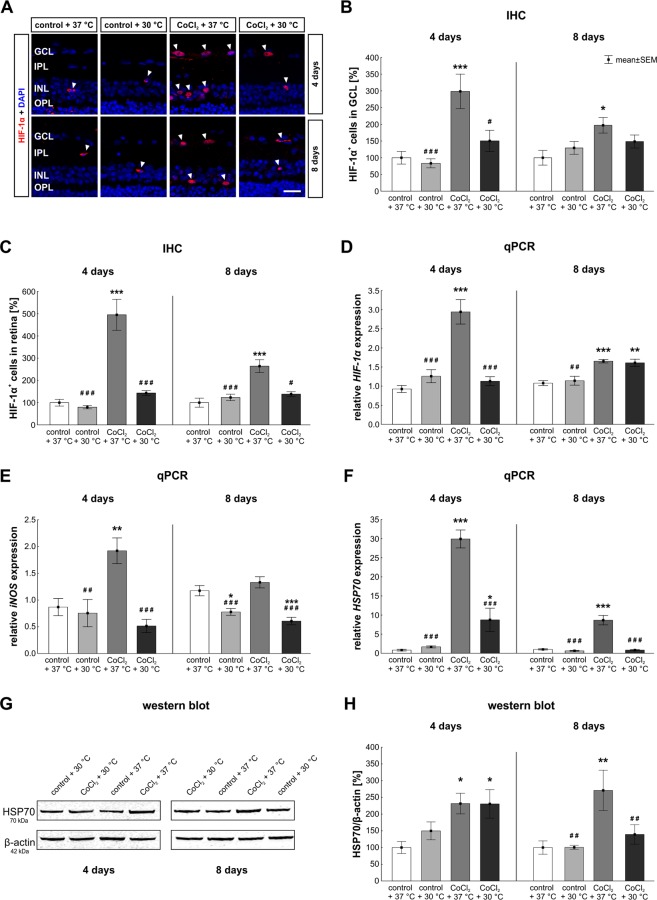
Reduced hypoxic processes and cellular stress through hypothermia. (A) Representative pictures of hypoxic cells in retinae. Hypoxic cells were stained with anti-HIF-1α (red, arrowheads). DAPI was used to visualize cell nuclei (blue). (B) Statistical evaluation of HIF-1α cell counts showed, that CoCl2 led to a strongly elevated number of HIF-1α+ cells located in the GCL after four and eight days. Hypothermia inhibited hypoxic processes and lowered hypoxia in most of the cells located in the GCL. (C) In regard to the number of hypoxic cells in the whole retina, CoCl2 again led to an increased hypoxia, whereas hypothermia alleviated hypoxic processes. (D) mRNA levels of HIF-1α were evaluated via qPCR. Analyses revealed an increased HIF-1α mRNA expression in the CoCl2 + 37 °C group at both days compared to the control + 37 °C group. At day four, hypothermia led to a control-like HIF-1α expression. (E) mRNA levels of iNOS were analyzed with qPCR. The iNOS mRNA expression was significantly increased by CoCl2 after four days. This effect was counteracted by hypothermia. At day eight, CoCl2 had no effect on iNOS expression, whereas both hypothermia treated groups, showed a reduced iNOS mRNA expression in comparison to the control group. (F) qPCR analysis regarding HSP70. CoCl2 strongly elevated the HSP70 mRNA expression level at days four and eight. At both points in time, hypothermia lowered HSP70 mRNA expression in the CoCl2 stressed retinae. (G) Protein levels of HSP70 (70 kDa) were measured via western blot and normalized against β-actin (42 kDa). (H) At day four, a significantly increased signal intensity of HSP70 was noted in both CoCl2 treated group, irrespectively of the temperature. Hypothermia treatment decreased the HSP70 signal intensity after eight days, causing no difference between the CoCl2 + 30 °C and the control + 37 °C group. Abbreviations: GCL = ganglion cell layer; IPL = inner plexiform layer; INL = inner nuclear layer; OPL = outer plexiform layer; IHC = immunohistochemistry; qPCR = quantitative real-time PCR. Values are mean ± SEM. B, C: n = 9–10/group; D-H: n = 6–7/group. Statistical differences to control + 37 °C group are marked with * and differences to CoCl2 + 37 °C group with #. #,*p < 0.05; ##,**p < 0.01; ###,***p < 0.001. Scale bar = 20 µm.

