Figure 3.
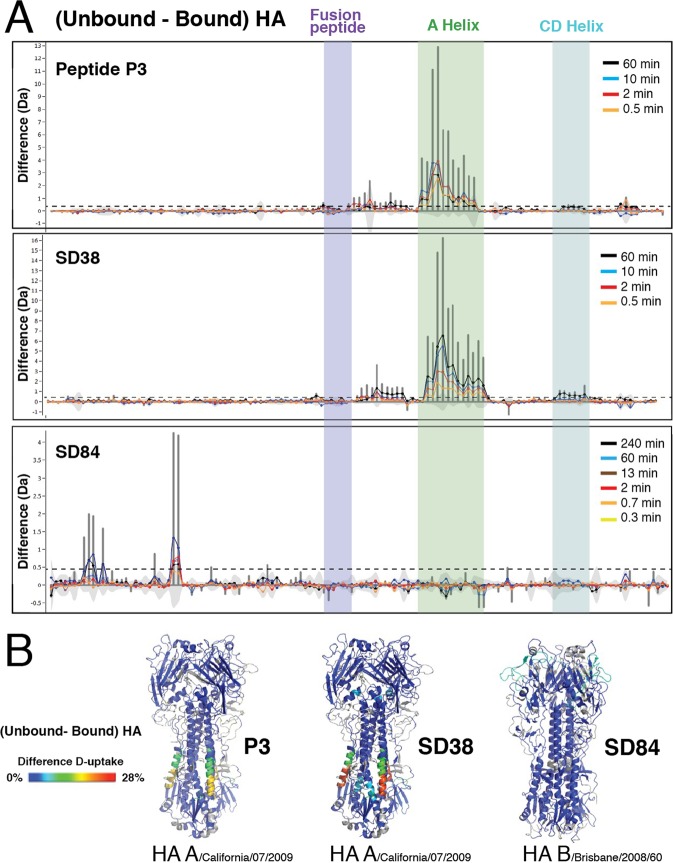
HDX-MS analysis of diverse drug candidates in complex with different HA subtypes. HDX-MS analysis of the broadly neutralizing HA stem binding molecules P3 and SD38 was performed on HA A California/07/2009 strain, whereas HA B/Brisbane/2008/60 strain was used for SD84, a head binding drug candidate that only recognizes HA-B strains. (A) Bar plots representing the difference in deuterium uptake for peptides originating from HA in the presence or absence of each drug molecule reveal the distinct effects of these drug candidates on HA. Each bar along the X-axis represents a unique HA peptide from the peptide library (ordered from N- to C- terminus based on the first amino acid of each peptide), and the Y-axis represents the total difference in D uptake for a given peptide. Light grey shades show the differential uptake errors for each peptide, and a black horizontal line represents the threshold above which deuterium uptake differences between free and bound HA were considered significant. This threshold corresponds to three times the average standard deviation between triplicate repeats, and is approximately 0.3 Da for all measured peptides. (B) The deuterium uptake difference between bound and unbound HA is projected on the trimeric structure of HA A/California/07/2009 (PDB: 3UBQ) for cyclic peptide P3 and SD38, and HA/B/Brisbane/2008/60 (PDB: 4FQM) for SD84. The differences in deuteration are represented in a rainbow color scheme, where blue corresponds to HA regions that are not affected by binding of the drug candidate, while red corresponds to 28% difference. HA regions that are not covered in our peptide library are shown in grey.

