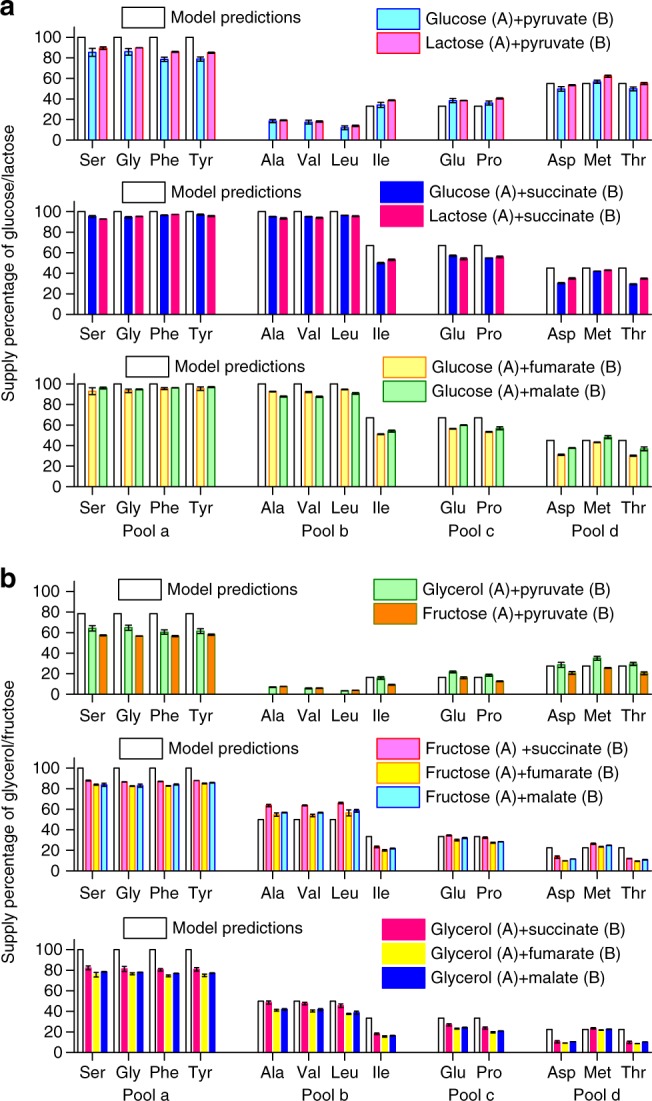
Fig. 3.

Suppliers of precursor pools in A + B cases. Vertical axes are the percentages of the carbon atoms from the first of the two sources indicated. Model predictions (in hollow bars, see Supplementary Table 4) are shown together with experimental results (in color bars). The source supplier of representative amino acids in Pools a–d was measured using 13C labeling (raw data from M-57 fragment; see Methods for details). Error bars represent standard deviations. Source data are provided as a Source Data file. a Glucose or lactose mixed with a Group B carbon source. b Fructose or glycerol mixed with a Group B carbon source
