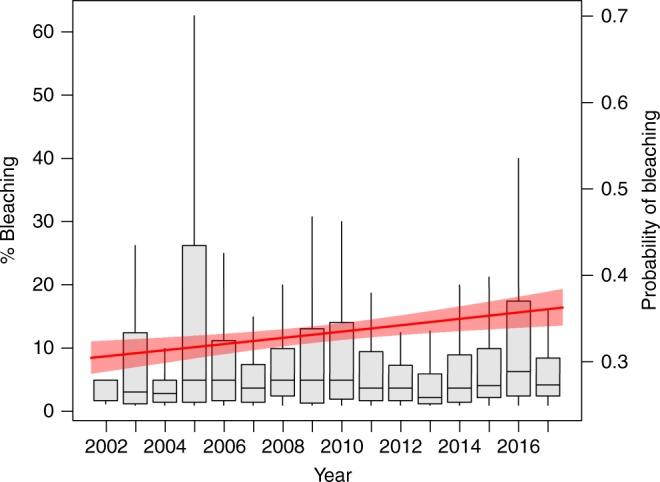
Fig. 3.

Percent and probability of coral bleaching over time. Percent of coral bleaching and probability of coral bleaching measured at 3351 sites in 81 countries, from 2002 to 2017. The boxplots are of the percent coral bleaching, which is measured on the left y axis. The center line is the mean percent bleaching, the bounds of the boxes are the interquartile range (25 and 75%), and the whiskers are the 95% range. The red line is the probability of coral bleaching over time, measured on the right y axis, and the shaded red region is the 95% confidence interval
