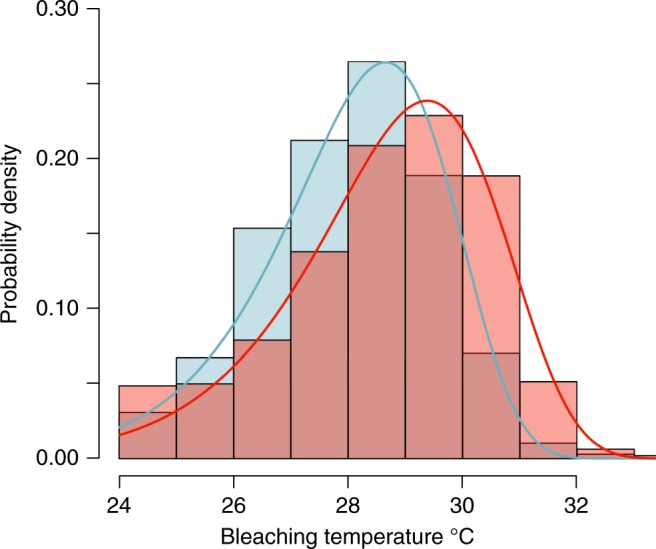
Fig. 4.

Probability density distributions of coral bleaching. Probability density distributions of coral bleaching from 1998 to 2006 (blue shade) and from 2007 to 2017 (peach shade), the mauve shade is where the distributions overlap; the blue and red lines show the best-fit Weibull probability density distributions (for the 1998 to 2006 data, the Weibull shape is 18.895 and the scale is 28.622, whereas for the 2007 to 2017 data the Weibull shape is 19.346, and the shape is 29.413). The change in coral-bleaching-sea-surface temperature is significantly different (Likelihood ratio test, Pr(>χ2) = 0.001) between decades
