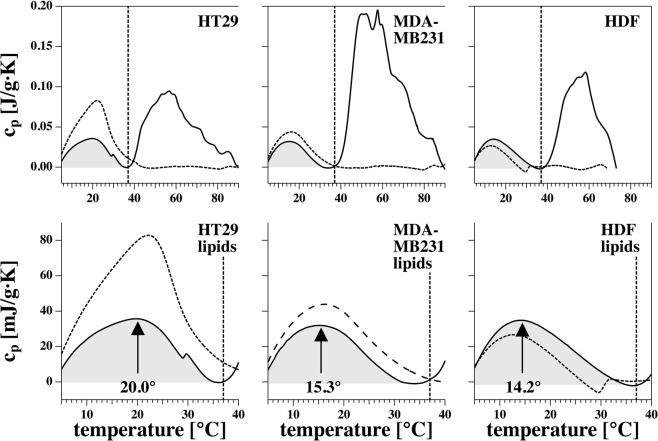
Figure 2.
Heat capacity profiles of the three investigated cell lines. Heat capacity profiles of HT29 (colon cancer cell line; left), MDA-MB231 (breast cancer cell line; middle), and HDF-n (normal dermal fibroblast cell line; right). Solid lines represent the first scan over the full temperature range (0–90 °C). Dashed lines represent the second calorimetric scan over the full temperature range. The protein peaks have disappeared (because the proteins have denaturated in the first scan over the full range of temperatures) while the lipid peaks remain. The amplitude of the lipid peaks can change between scans due to subtraction of base line but the position of the peak (temperature) is more constant between scans. The vertical line represents the physiological temperature. Bottom panel: enlargement of the top panel from 0–40 °C, where approximate transition temperatures are indicated.

