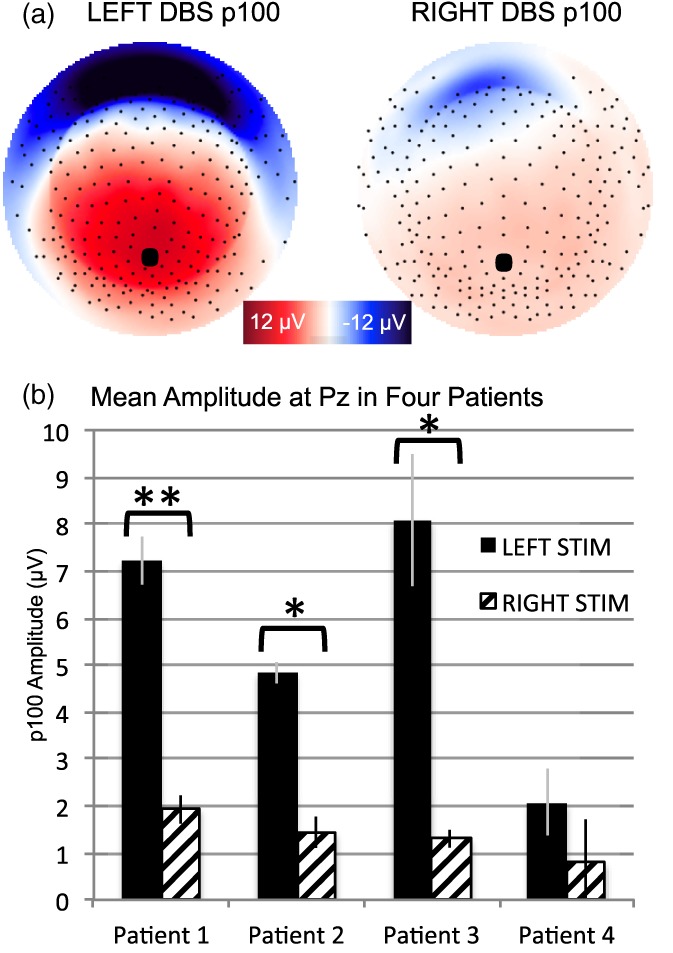
Figure 4.

Amplitude of p100 is greater following left versus right hemisphere stimulation. (a) Topography of grand average scalp potentials (average of 15 sessions, n = 4) following stimulation from left hemisphere (left) and right hemisphere (right) at 100 ms. topography shown as if looking town on the head surface with nose oriented to the top of the page. Saturated color indicates higher amplitude (red = positive; blue = negative). (b) Means comparison within subjects. Corrected statistical threshold: *p = .0125, **p < .001
