
Figure 2.
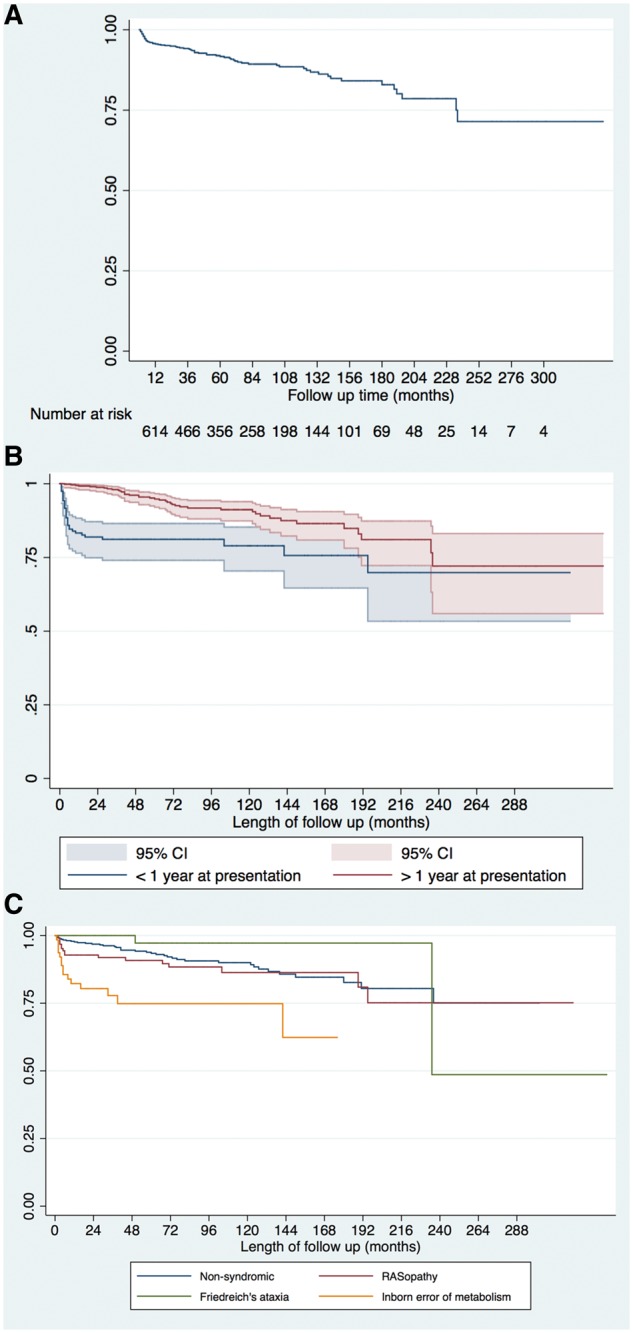
The Kaplan–Meier curves for survival free from all-cause mortality or cardiac transplantation; (A) for whole cohort; (B) stratified by age of presentation, Log rank test P < 0.0001. 95% CI are shown. (C) Stratified by aetiology, Log rank test <0.0001.